
Key takeaways
🔦 UX research synthesis turns raw data into meaningful insights that inform design decisions.
🔍 Identifying patterns and trends distinguishes recurring behaviors from emerging changes to refine UX.
💡 Enhancing decision-making connects research findings directly to product improvements.
📚 Organizing research efficiently improves accessibility and usability for teams.
🍯 Using structured synthesis methods translates research findings into actionable UX improvements.
In today’s digital landscape, delivering an exceptional user experience (UX) is essential for the success of any product or website.
Without proper UX research, users may quickly become frustrated and seek alternatives. This is where UX research synthesis comes in.
By analyzing research findings, businesses can identify user behavior patterns and turn raw data into actionable UX insights.
In this article, we’ll explore the key aspects of UX research synthesis, why it’s essential, and how to implement it effectively. Let’s dive in!
What is data synthesis?

Data synthesis combines, analyses, and interprets disparate data from different UX research methods to identify key insights, patterns, and directions for further design.
For UX researchers and designers, synthesis is not just about bringing data together but turning raw data (interviews, observations, surveys, and analytics) into meaningful insights that help inform product decisions.
Why is data synthesis critical?
UX research often results in the accumulation of vast amounts of disparate information, which needs to be brought from chaos to structure. Synthesis helps to structure it and highlight what’s important.
Users may express their needs in different words. Yet their valid problems and expectations are recurring, which allows us to identify particular patterns. Due to synthesis we detect and see these hidden patterns.
The synthesis results directly influence design decisions: which features to develop, which scenarios to optimise, and which hypotheses to test.
At the same time, clearly articulated insights help explain to the team why particular UX solutions are vital and how they will improve the user experience.
As Bill Buxton, partner researcher at Microsoft Research, claims:
The best products are born from a deep empathy with the people who use them.
Patterns vs trends in data
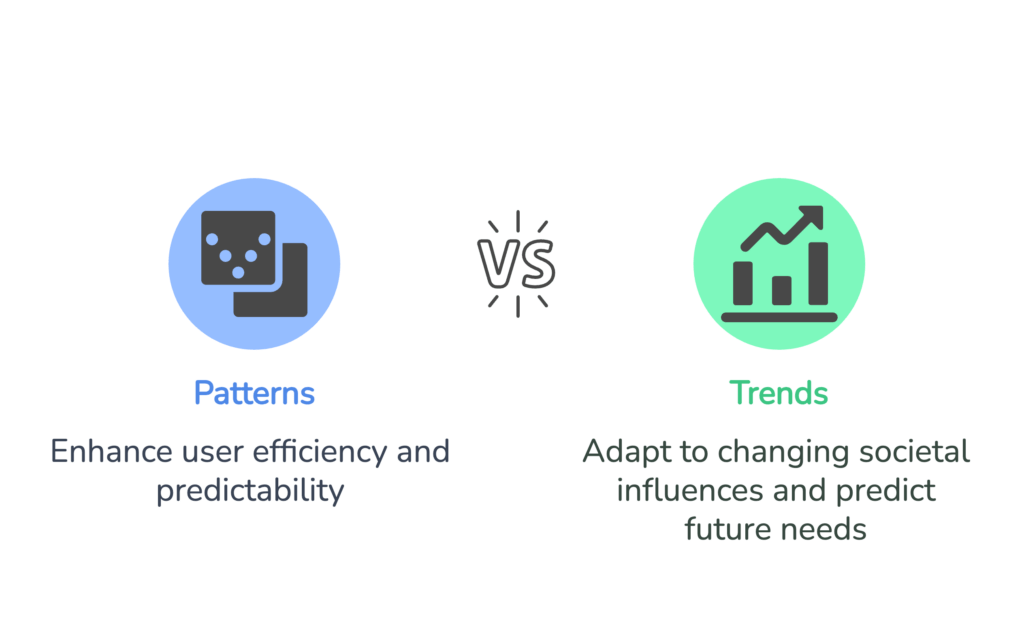
When synthesizing data, UX researchers and designers need to distinguish between patterns and trends, as these concepts play different roles in product decisions.
The main focus of UX design is not to make the user think. When the interface is logical and clear, the user doesn’t need to put in extra effort to achieve a goal.
Over time, designers and developers have noticed that certain mechanics on websites are more effective than others.
Successful solutions have evolved into UX patterns – proven ways that help users do what they want to do faster and easier.
To avoid reinventing the wheel every time, developers and designers started to use patterns already familiar to users on websites to make the interface predictable and understandable.
All patterns in web design are developed based on user experience, and there are different formulated UX rules.
If we talk about trends in visual art (mainly design of various kinds – from interior design to web design), they are influenced by cinema, art in general, sports, politics – you could say, the entire cultural sphere of human life.
Or, in short, everything that society is concerned with at the moment. This affects both the design itself and its creators because they don’t live in a vacuum.
📌 For example: concern about ecology penetrates society, is reflected in fashionable colors of clothes for the last few years, and gives birth to new requirements for production (sometimes some brands lose a lot of customers because of scandals related to concern for nature). Fashion is not a fad, but a logical social demand, which always has an underlying problem or conflict.
Trends are always something new. Sure, they may come back, but the point is that they are different from what we are used to.
It happens that trends develop over many years, even though it may seem to us that nothing new is happening.
Hence, trends help predict future user needs and adapt the product to the changing environment. However, they require validation, as some of them may be temporary.
How to use patterns and trends in UX design?
👉 Patterns: These are used to optimize the current UX. They are reliable, repeatable, and should be considered in design.
👉 Trends: They design for the future and are mostly useful for strategic product development and innovation.
The optimal approach is to look for an overlap between patterns and trends, striving for great usability. If a trend confirms an already existing pattern, it is a signal for action.
If a trend contradicts an established pattern, perhaps users are changing their habits, the product needs to adapt.
What is synthesis in UX research?

UX data synthesis is the process of combining, analyzing, and interpreting collected information to identify key patterns, insights, and opportunities to improve the user experience.
It’s not just about collecting data into a coherent whole but also turning raw observations into meaningful insights that help UX designers and product teams make informed decisions.
Synthesis is performed after data collection as part of UX research. It can occur after individual research studies. For instance, after in-depth interviews, usability testing, or metrics analysis.
At the end of a research phase, results from different methods (qualitative and quantitative data) are combined.
In iterative UX research, synthesis can be done in stages, refining and adding insights as new data emerges.
We need synthesis for many reasons:
- To find meaningful patterns – to identify recurring problems, patterns of behavior, and core user needs.
- To articulate clear insights – without synthesis, data remains just facts without turning into useful insights for design.
- To link research to product decisions – synthesis helps the team understand what interface or functionality changes are really important.
- To communicate results effectively – structured insights are easier to communicate to stakeholders and the development team
A great rule of thumb is following the principle of Lindon Leader, Graphic Designer, and Author of the FedEx logo:
I strive for two things in design: simplicity and clarity. Great design is born of those two things.
UX research synthesis vs analysis
UX researchers work with massive amounts of data every day: interviews, observations, tests, and surveys.
Yet, the data collected is not valuable in itself – it needs to be properly analyzed and synthesised to provide useful insights. Let’s break it down.
UX research analysis: parsing information into parts
Analysis is the process of breaking down data into structured elements and identifying patterns and regularities. We look for answers to the ‘what’ and ‘why’ questions. Yet, we can analyse UX research data in many ways:
- Read and code interviews, highlighting key themes.
- Categorize user responses.
- Identify patterns of behaviour.
- Use statistics to confirm hypotheses.
📌 Example: Analysing user interviews, you notice that 6 out of 10 people complain about difficult navigation. This is a signal: the problem exists.
UX research synthesis: combining data into insights
The next step of high-quality UX research is synthesis. We take the processed data and combine it into meaningful insights. The important question to answer here is, ‘What does this mean for the product?’
The data synthesis can be performed following these steps:
- Group problems and insights.
- Form clear conclusions.
- Create relevant visual artifacts: affinity diagrams, and user journey maps.
- Make recommendations to the product team.
📌 Example: You find that complex navigation is causing you to lose users. Synthesis allows you to formulate a clear insight: ‘You need to simplify the menu structure and add tooltips’.
Hence, analysis gives us raw data, synthesis turns it into solutions. They are two parts of a single process: firstly, we analyse, break the data into parts and identify patterns, and during synthesis we combine findings and create recommendations.
What data do we synthesize in UX research?

Common methods of product research include user surveys, questionnaires, usability testing, ethnographic research, competitive analysis, customer journey mapping, and prototype testing.
🔽 Ready to see it in action? Try it yourself with UXtweak’s usability testing tools!

These practices help teams collect qualitative and quantitative data, better understand user behavior, identify pain points, and uncover opportunities for innovation.
In UX research, analysis and synthesis are closely related but distinct processes. Both are essential for making sense of research data and informing design decisions.
Understanding their differences helps UX researchers and designers extract meaningful insights effectively.
Synthesis in UX research is a crucial step that turns disparate data into meaningful insights.
It helps researchers and designers understand what matters to users, what patterns and trends are evident in the research, and what product changes need to be implemented.
It is especially important when data is derived from multiple sources – interviews, observations, analytics, surveys, A/B testing.
Without proper synthesis, all this information remains disparate facts that are difficult to interpret and use in design.
🍯 Synthesize your research with UXtweak – an all-in-one UX research platform that seamlessly blends quantitative data and qualitative insights for smarter decisions!
Data synthesis for qualitative research
💬 In-depth interviews with users
Following the interview, the UX researcher receives multiple pages of records, notes, and quotes. Once interviews have been performed, the primary goal is to extract main themes, patterns, and insights.
All user replies are analyzed to identify reoccurring motivations, worries, and wishes. A coding approach may be used to divide the replies into understandable chunks and categorize them into major groups.
Following that, generalized user personas are developed to describe common demands and behavioral tendencies.
Want to include user interviews in your UX research?
Try UXtweak’s Live Interviews! Seamlessly schedule, recruit, conduct, and analyze your all user interviews.
⬇️ Learn more about the feature and be the first to try it!
🔍 Observations
All notes taken during observations are analyzed and organized. Patterns such as the most efficient interaction pathways, problems, and unexpected usage circumstances are identified based on the recorded actions and behavioral events.
The data is then used to make modifications to the product. Synthesis helps connect observations to users’ real-world pains. Opportunities for UX improvement that users may not have been directly told about are uncovered.
📔 Diary studies
Because this strategy includes long-term monitoring, the primary goal is to detect trends. The chronology of user contacts with the product, main sources of discontent, and good experiences are examined.
User records are sorted by subject, and timeline charts are constructed to show product consumption over time.
💡 Usability testing
During testing, any problems, task delays, navigation difficulties, and user feedback are recorded. The collected data is grouped according to the number of issues.
A priority is then created, with severe flaws listed separately and smaller barriers recognized as potential areas for improvement.
Data synthesis for quantitative research
While data synthesis in UX research is more often applied to qualitative data, it can also be useful when working with quantitative research.
🧐 User behavior analytics (product analytics, click maps, conversion funnels)
Synthesis helps link metrics to causes:
- If users are abandoning a form en masse, qualitative research can explain why this is happening.
- If a metric shows a decline in retention, interview data can answer what exactly is keeping users from coming back.
🗒️ Surveys and questionnaires
Quantitative surveys provide numerical data, but without synthesis, it’s difficult to understand the underlying meaning. Synthesis helps identify user groups with different needs.
Combining quantitative data with qualitative research makes conclusions more reliable.
⚖️ A/B testing
Data synthesis helps you not just see that one version of a design works better than another but also understand why.
Hence, for each type of data, you need to choose a specific approach:
For qualitative data:
- Affinity mapping – grouping similar themes and insights based on notes and quotes.
- Persona creation – aggregating data on user expectations, pains, and motivations.
- User journey maps – mapping key points of user interaction with the product.
- Finding patterns – identifying recurring problems in interviews and testing.
For quantitative data:
- Creating visualisations (graphs, dashboards) – helps spot trends.
- User segmentation – separating data into different groups (new vs. loyal users).
- Linking numbers to qualitative insights – e.g. bounce rate metrics + reasons identified in interviews.
Organizing UX research data for the synthesis process

UX research generates a great amount of information: interviews, notes, testing, behavioral analytics, and survey results.
But without effective filtering and segmentation, this data can become a chaotic jumble of facts from which it’s difficult to extract useful insights.
Filtering, segmenting, and adding codes/tags can help UX researchers quickly find relevant information, compare different user groups, and make more informed decisions.
The process of organizing data for the synthesis process includes:
- Centralizing UX research data
- Filtering research data
- Segmenting user research data
- Adding codes and tags
Centralizing UX research data
Centralizing UX research data allows teams to not just store information but to quickly find relevant insights, link qualitative and quantitative findings, and share knowledge internally.
Businesses to make decisions based on factual data, not assumptions. To ensure that data is not just collected in one place but also works for the team, it is important to properly organize its storage and access.
1. Choose a storage system
Options depend on the needs and scale of the team:
👉 Simple solutions: Google Drive, Notion, Confluence – suitable for small teams and for storing textual information.
👉 Specialised platforms: Dovetail, Condens, Aurelius – help structure UX research, link data, and find insights faster.
👉 Corporate knowledge bases: If your company already uses knowledge-sharing systems (Miro, Airtable, Wiki), you can integrate UX data into them.
👉 General rule of thumb: Data should be easily accessible and structured – a chaotic repository is little better than a complete lack of a centralised system.
2. Structure the data correctly
In order for the team to find the research they need quickly, the data needs to be organised in an understandable system. For example:
By study type:
- In-depth interviews
- Usability tests
- Surveys
- Behavioural analytics
By product or feature:
- Dashboards
- Payment process
- User Profile
By key insight:
- Problems with onboarding
- Distrust of the payment system
- Low engagement with content
Relevant and structured categorization helps you to detect not only the studies themselves but also how they relate to each other.
Even if data is stored centrally, you need to be able to find it quickly. The solution is a tagging and metadata system that helps filter studies.
This speeds up information retrieval and makes the knowledge base usable even for those who have not participated in the research.
3. Keep data up to date
Centralisation only works when the information is up-to-date. Important:
- Provide dates of research and the last data update.
- Designate those responsible for maintaining the knowledge base.
- Train the team on how to use the data warehouse.
If the UX designer or researcher is not sure that the data is up to date, he or she can ignore existing insights and launch a new study.
Filtering research data
Once the research is collected in a centralized UX research repository, the next step is to easily find and select the information you need. If you can’t quickly find data on a particular topic, the research loses its value.
1. Categorise research by data collection method
- In-depth interviews
- Diary studies
- Usability tests
- Digital analytics analyses
- Surveys
2. Time filtering
- Recent studies (e.g., last 6 months)
- Long-term studies (changes over time)
- Outdated data that needs to be updated
3. Filtering by product, feature, or funnel stage
- Initial product familiarisation (onboarding)
- Main usage scenarios
- Payment and subscription process
- Returning users
Hence, filtering allows you to navigate the knowledge base and find relevant research at the right moment.
Segmenting user research data
Users are rarely a homogeneous group. Their experiences, needs, and pain points can vary significantly. That’s why segmenting UX research data is an important tool for understanding different types of users.
👤 By user type:
- New vs. loyal users
- Beginners vs. advanced users
- B2B vs. B2C audience
👤 By behavior:
- Frequency of product usage.
- The main tasks that the user solves.
- Product entry channel (desktop, mobile app).
👤 By demographics (if relevant):
- Age, region, level of technical literacy.
- Job role (e.g. designer, manager, developer in a B2B product).
Adding codes and tags
Data coding is the process by which a UX researcher assigns certain labels (codes or tags) to different parts of the research to make it easier to analyze.
👉 Qualitative research (interviews, observations) – Interview snippets are tagged with key codes to quickly find recurring themes.
👉 Usability testing – User errors during tests are coded by problem type.
👉 Quantitative research (surveys, analytics) – Quantitative research results can be tagged by metrics: #low_conversion, #high_response rate, #low_retention
Here are some tips to use codes and tags effectively:
- Use consistent tags across the team to search for better work.
- Group similar codes into larger categories.
- Simplify tag searches through filters in your data warehouse system.
📌 Example: If a designer is looking for data on navigation, they simply enter the tag #navigation_problem and get all studies where navigation problems were mentioned – regardless of the study method.
How to do synthesis in UX research (main synthesis methods)

In UX research, data synthesis is converting fragmented information from interviews, observations, tests, and surveys into useful insights for decision-making processes.
To do this efficiently, UX researchers employ several synthesis strategies based on the data type, amount, and study objectives. Here is a comprehensive guide for applying key techniques to synthesize UX research findings.
These methods assist you in analyzing and organizing data gathered from interviews, observations, surveys, and other research activities to reveal essential insights and enable informed decision-making.
📍 Affinity mapping
Affinity maps are structures that help to arrange large amounts of data, especially from in-depth interviews, workshops, and observations. This method would be beneficial for you when there are lots of notes but no clear patterns.
Step-by-step guide:
- Gather data – compile all notes from interviews, usability assessments, user feedback, and various other sources. This data can take the form of quotes, issues, and observations.
- Card breakdown – jot down each separate observation or idea on post-it notes (either physical or on platforms like Miro, FigJam, Notion).
- Categorizing – begin arranging the notes into categories based on similarities: for instance, group all observations related to navigational difficulty together and all suggestions for functionality improvements in another category.
- Labeling groups – assign a name to each category that captures its essence (for example, “Onboarding Issues,” “Ambiguous CTA Buttons”).
- Prioritization – identify the most prevalent or crucial topics to address first.
This approach is particularly effective when dealing with a substantial amount of diverse qualitative data and aiming to quickly pinpoint significant patterns. It’s ideal for analyzing interviews, usability assessments, and user feedback.
📍 Thematic analysis
Thematic analysis is suitable for working with textual data: interview transcripts, open-ended responses from surveys, and notes from usability tests.
If you have a lot of textual data and want to identify recurring themes, this method will work for you.
How to do it:
- Read all the data carefully – note the important key points in the text.
- Identify primary codes – assign short labels (codes) to similar fragments (e.g., unclear navigation, fear of payment).
- Combine codes into themes – group similar codes into larger categories (e.g., ‘trust barrier’ might include ‘fear of payment’ and ‘not enough product information’).
- Describe each theme – articulate what it means and what examples from the data support it.
- Prioritize the themes – which ones are most relevant to the product?
Thematic analysis helps you understand the user experience more deeply, especially if you need to analyze large amounts of textual data.
📍 2×2 Matrix
This method is useful when you need to decompose data on the axes of priority, frequency, influence, or other criteria. It helps you quickly understand what to focus on first.
How to do it:
- Define the axes – choose two parameters that are important to analyze.
- Arrange the data on a matrix – categorize the identified problems or ideas into the appropriate quadrants.
- Prioritise – items in the top right corner (high impact, easy implementation) need immediate attention.
- Formulate conclusions – which problems are critical? Which ones can be deferred?
A 2×2 matrix helps to prioritize the findings of the study, especially if you need to choose which UX problems to address first.
📍 Spectrums
This method is useful when you need to identify a range of user opinions or behaviors. It’s great if you need to understand differences in user experience (e.g., novices vs. experts).
How to do it:
- Identify key metrics – e.g., comfort level with the technology, trust in the product, and engagement.
- Place users on a spectrum – categorize their responses on a scale from one value to another (e.g. ‘Very comfortable’ → ‘Very uncomfortable’).
- Identify patterns – which user groups are having difficulty? Where are extreme opinions observed?
- Identify how UX could be improved – which user segments need special attention?
The method helps to segment users more deeply and understand which groups are experiencing more problems.
📍 User journey mapping
User journey mapping is useful when visualizing the entire user experience with a product and finding problematic moments.
How to do it:
- Identify key user journey stages (e.g., ‘Finding information’ → ‘Registering’ → ‘Using the product’).
- Add user thoughts and emotions – what does the person experience at each stage?
- Identify pain points – where do problems or doubts arise?
- Identify opportunities for improvement – what UX solutions will help improve the experience?
This method helps to see problems in the user experience and find opportunities for improvement.
💡 Pro Tip
Learn more about mapping user journeys in our User Journey Map Examples guide.
📍 Service blueprinting
This method is useful if the product involves many internal processes and interactions between the user and the business (e.g. hotel booking or food delivery).
How to do it:
- Identify the key steps of user interaction with the service.
- Add front-stage processes (what the user sees).
- Add back-stage processes (what happens internally).
- Outline problem areas and improvements.
Service Blueprint helps to improve complex processes and find weaknesses in the user experience.
Challenges with the synthesis process in user research

Data synthesis in UX research is one of the most complex and critical steps. This is where disparate observations, user interviews, and testing are turned into valuable insights that can influence product decisions.
But the synthesis process isn’t just about grouping notes. It deals with ambiguity, large amounts of information, and the need to make decisions in the face of incomplete data.
Let’s break down the key challenges of synthesis in UX research and how to overcome them.
Excessive data and information chaos
⚠️ Problem:
After interviews, tests, and surveys, you have hundreds of notes, dozens of hours of audio recordings, and lots of screenshots. Making sense of this deluge of information is difficult, and you can miss important details.
💡 How to solve it:
- Centralise data – use research repositories (e.g., Condens, Dovetail).
- Work with tags and codes – flag key themes at the analysis stage.
- Break the process into stages – filter the data first, then categorize the insights.
Subjectivity and cognitive distortions
⚠️ Problem:
Researchers often interpret data through the lens of their own experiences and expectations. This can lead to biased conclusions.
💡 How to solve it:
- Use team synthesis – discuss insights as a group to reduce subjectivity.
- Use blind analysis – analyse data without hypotheses first, then test them.
- Rely on data, not opinion – use user quotes and quantitative evidence.
Loss of context when synthesising data
⚠️ Problem:
UX researchers tend to articulate key themes when synthesising UX, but sometimes this leads to oversimplification of the data. As a result, nuances and individual user needs are lost.
💡 How to solve it:
- Keep examples and quotes from users – they help convey context.
- Use segmentation – break down insights by user group rather than lumping them into one universal problem.
- Test hypotheses with new data – don’t limit yourself to primary research.
Unclear or poor data visualisation
⚠️ Problem:
Even if you have clear insights, it’s hard to communicate them to the team without visualisation. If data remains as long text reports, it’s harder to absorb.
💡 How to solve it:
- Use affinity diagrams (Affinity Mapping), 2×2 matrices, and user journey maps.
- Choose visual tools – UXtweak, Miro, and FigJam help structure information.
- Adhere to the principle ‘one insight – one visualisation’ – don’t overload diagrams with unnecessary information.
Lack of connection between synthesis and final solutions
⚠️ Problem:
Sometimes insights stay in documents and don’t influence actual product decisions. Teams may not understand how to use the research findings.
💡 How to solve it:
- Formulate actionable recommendations – not just ‘users find it difficult’ but ‘add a CTA button at the top of the screen’.
- Integrate insights into workflows – discuss them with designers and product managers.
- Conduct UX presentations – use storytelling to engage the team.
Hence, synthesis is not just a stage of UX research but a process of turning data into meaningful insights. It requires care, objectivity, and a structured approach.
By avoiding common problems, you can make research more accurate and the product more user-friendly.
The best tools for UX research synthesis
Synthesising UX research data is a complex but crucial step where disparate observations are turned into clear insights.
High-quality synthesis allows researchers and designers to make more meaningful decisions and, therefore, directly affects the quality of the user experience.
To simplify this process, there are special tools that help to structure, analyse, and visualise UX research data.
Let’s look at the best tools for synthesizing UX data, their key features, and in which scenarios they are most useful.
UXtweak
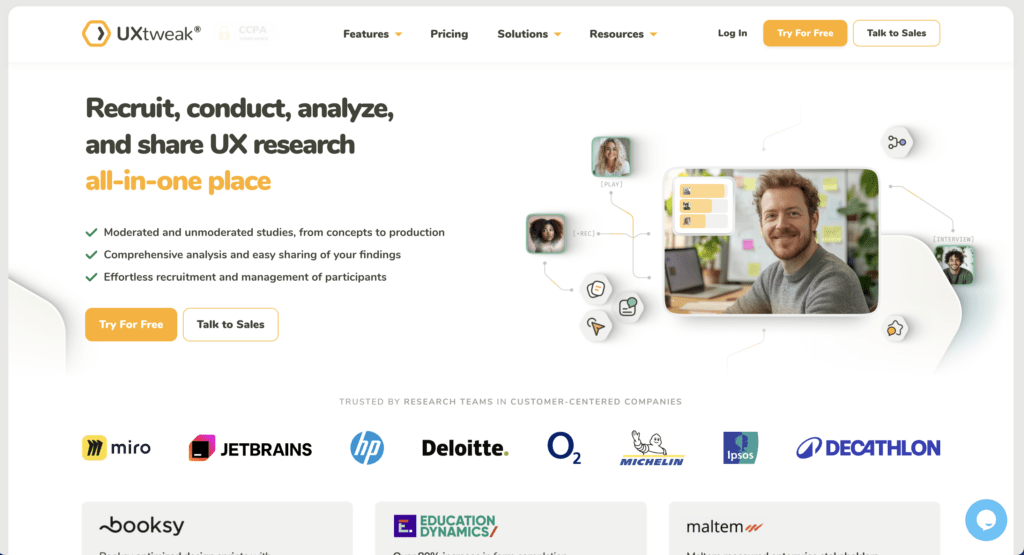
UXtweak is a comprehensive user research platform designed to help organizations synthesize insights effectively throughout the development process—from early concepts to the final product.
With a robust suite of usability testing tools, including prototype testing, five-second testing, screen recordings, live interviews, remote usability studies, and first-click tests, UXtweak streamlines the research process.
Its intuitive survey tool, advanced analysis features, detailed summaries, study audit, and built-in participant pool make organizing, interpreting, and applying research findings faster, more efficient, and accessible.
This ensures teams can turn raw data into actionable UX improvements with ease.
Features
- Surveys and polls
- Website Usability Testing Tool
- Session Recording with Website Heatmaps (Click, Scroll, Move, Tap)
- Mobile App Usability Testing
- Prototype Testing (Figma, Invision, Axure)
- Tree Testing Tool
- Card Sorting Tool
- Preference Tests
- 5 Second Test
- First Click Test
UXtweak pricing
- Free Plan (€0/month) – Ideal for experimenting with UX research tools at no cost. Includes 15 responses/month, 1 active study, and 14-day result access.
- Basic Plan (€113/month, annual billing) – Designed for small teams needing essential UX research features. Offers 50 responses/month (upgradable), 1 active study (upgradable), unlimited tasks per study, and 12-month data retention.
- Custom Plan (Individual pricing) – Tailored for organizations requiring advanced solutions. Provides unlimited active studies and tasks, customizable responses, live interviews, and access to a global user panel.
Miro
Miro is a useful tool for collaboratively analyzing UX data in real time. Its flexibility allows for different synthesis methods, such as:
- Affinity Diagrams – to group notes and look for patterns.
- User Journey Maps – to help visualise the user journey and identify pain points.
- 2×2 matrices – for prioritizing insights.
When to use Miro?
- Face-to-face UX research when specialised online tools are not needed.
- When a research team works collaboratively, a collaborative analysis tool is needed.
- To create clear visualisations that can be easily presented to stakeholders.
Excel – a classic tool for manual UX data analysis
Sometimes, nothing can replace the simplicity and versatility of Excel. Even though it’s not a specialised tool for UX research, Excel is great at getting things done:
- Coding data – you can assign tags and filter results.
- Analysing qualitative and quantitative data – tables and summary charts help you see patterns.
- Flexible data manipulation – the ability to manually control the synthesis process.
When to use Excel?
- If you need maximum control over the synthesis process.
- To work with small amounts of data when there is no point in using complex tools.
- If you need flexibility in processing information without being tied to specific UX platforms.
Condens – UX research repository
One of the important aspects of UX research is data storage and accessibility. Condens solves this problem by offering:
- Centralised storage of UX research – all data stays in one place, and the team can easily access it.
- Categorisation and search across studies – helps find past insights and use them for new solutions.
- Multimedia support – notes, interview transcriptions, video and audio recordings can be stored.
When to use Condens?
- If you need to create a UX research knowledge base that is accessible to the whole team.
- When it’s important to reuse data rather than analysing it from scratch.
- For long-term storage of synthesis results that you can easily refer back to in the future.
How to choose a tool for UX research synthesis?
Choosing a tool depends on your objectives:
- If you need a powerful tool for data synthesis and visualisation → UXtweak
- If collaboration and easy visualisation are important → Miro
- If you need to manually analyse data without complex platforms → Excel
- If you want to create a centralised UX repository → Condens
Using the right tools will help simplify the synthesis process, reduce cognitive load, and increase the accuracy of insights. And that, in turn, will lead to better UX solutions and a better user experience.
You can integrate UXtweak with Condens, allowing you to quickly transfer data between the two platforms for more in-depth UX analysis.
Wrapping up
UX research synthesis helps you to understand audience needs, behavior, and logic, increase user loyalty, avoid erroneous business decisions, and save budget.
UX research is divided into qualitative and quantitative types.
Qualitative research answers the questions ‘Why?’ ‘How exactly?’ and help understand customer behavior, while quantitative research answers the questions ‘How often?’, ‘How much?’ and measures service metrics.
Based on the research results, hypotheses to be tested or a list of improvements and refinements are drawn up to receive a final product version of high quality. This is where UXtweak comes in.
From usability testing to live interviews, A/B testing, surveys and so much more, it’s a platform to recruit, conduct, analyze, and synthesize qualitative and quantitative research findings—all in one place.
Want to see it in action? Book a demo today!


📌 For example: it is more convenient to add an item to the basket directly from the product list page, rather than going to the product page first. Dragging a file to upload, swiping left to delete a message, or showing a modal window for additional information – all of these have proven to be more convenient and intuitive for users.