
One of the solutions is to begin your studies in Statistics, but you probably don’t have time for starting your Master’s degree from the beginning. Understand the basic concepts, learn how to analyze survey data and find more about your users.
EXTRA TIP: It is important to know your expectations. What part of the design do you want to improve, what question you want to answer, and what methodology will help you achieve that? Asking the right questions in testing is the key for the research as such.
In this article we’ll explain how to choose the right tool for survey analysis, how to read graphs and charts, where to start the data analysis process and expose 6 ultimate tips for analyzing big piles of data.
What will we be looking at in this post:
Choose the right tool for survey analysis
Where to start analyzing data?
6 tips on how to start analyzing the data
Conclusion
Choose the right tool for survey analysis
When choosing a tool for surveys, you should think about if offers the possibility to analyze survey data. If you are not a friend with Excel or Google Sheet, you may think about the UX tool that provides you with the analysis. Let’s say that you need Website testing to understand the user’s interaction with the design.
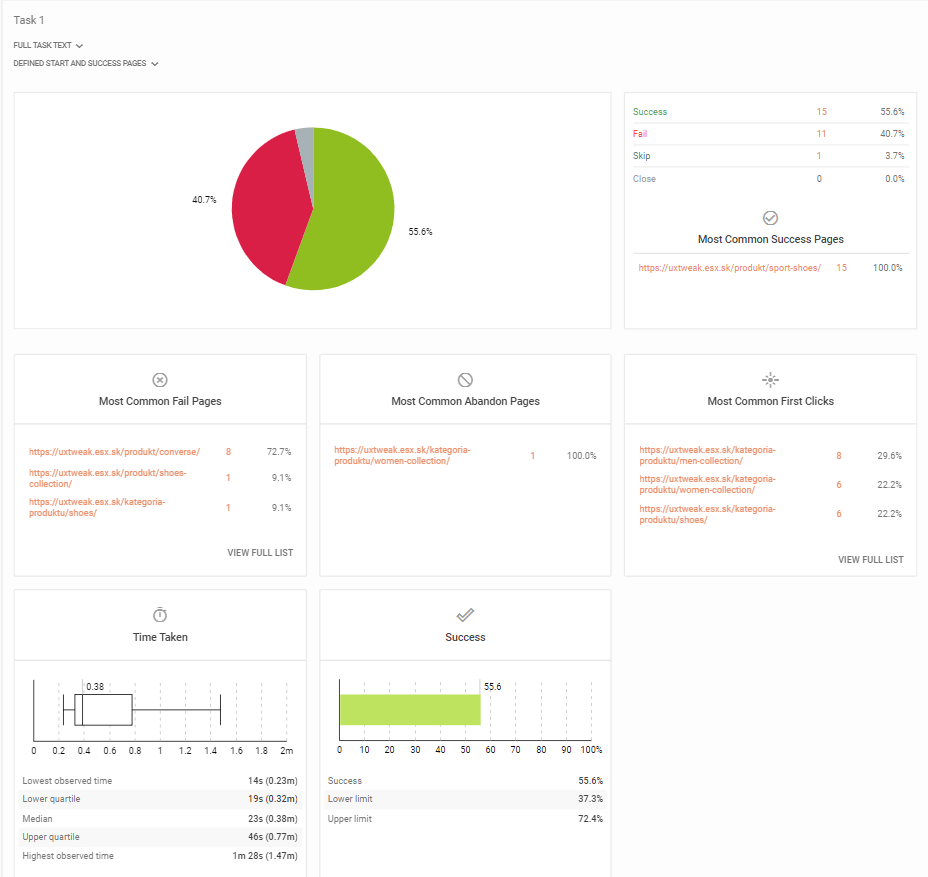
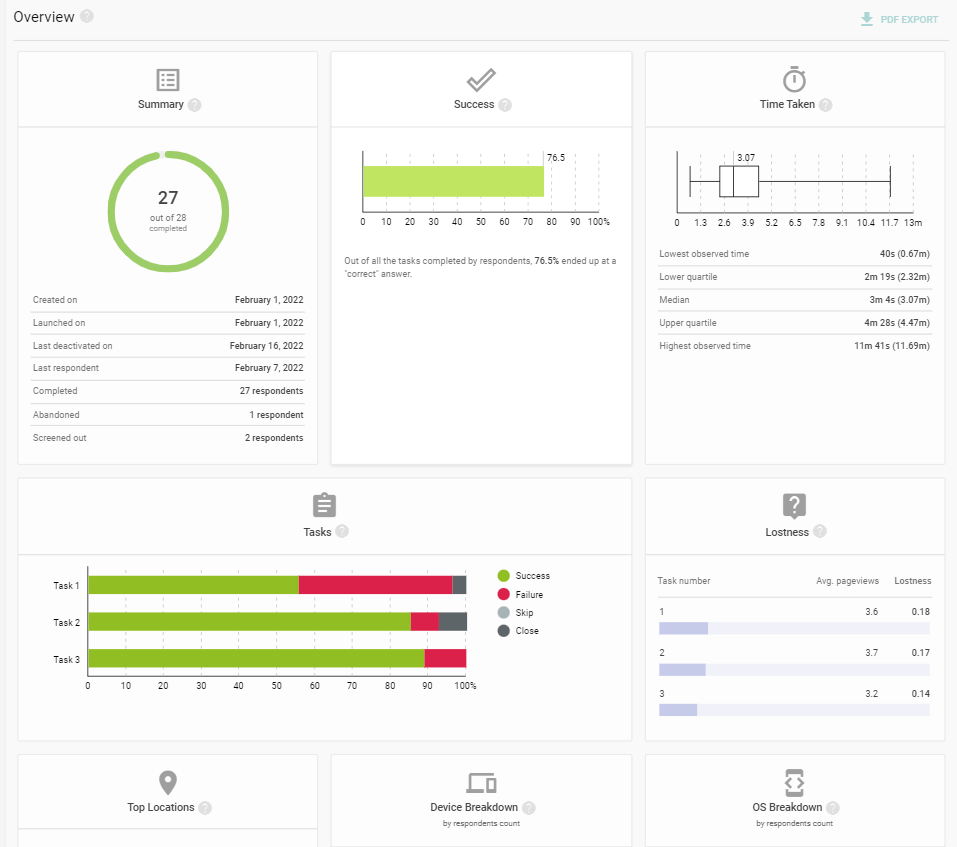
With some tools, such as UXtweak, you will be able to see preliminary results during the process of collecting data. At the end of the study, you can find a report with information concerning the number of respondents who finished the task, how long it took, how many of them were successful. Put the calculator back on the shelf. Everything is right there in one place.
Are you conducting Session Recording or Website Testing? In the results, you will get information regarding the location of your users, device, OS, browser that they use, or screen resolution.
For instance, you can look closely at the behavior of old versus new users who completed the task. Do you feel lost? Filters can be helpful to separate those, who completed the tasks, and those who finished earlier or filters detecting answers from multi-option questions.
Where to start analyzing data?
You probably spend some time planning and conducting the research. You did a great job there. We know that analyze the survey data is complicated, but it doesn’t have to be that way. Inconsistent data are such a waste of time, energy, and money. Don’t lose your potential with insufficient data analysis.
Here are our tips on how to begin the analysis:
1. What is it that you want to investigate?
One of the reasons why you are drowning in data is that you don’t have a clear goal. Sometimes we get overwhelmed by the data and we are like Dory in Finding Nemo: Oh, look, this is interesting, and this, what and this. You simply lose your focus on what is important.
Try to define a clear goal you want to focus on before the study even begins. It can be 1 or 2 goals, we usually recommend not setting anything more than that. Having many different goals can get you confused and result in not being able to achieve any of them to the maximum. Having a goal simplifies the analysis process greatly, as you now know what to look for, things to point out and what will need to be improved first.
It also helps you prioritize the issues and not rush into improving everything at once. Some of your findings may be more important than others. Rank them from low to high severity depending on how they affect the product and the project as a whole and then make improvements gradually, starting from the most severe ones.
2. Clean your data
Those who didn’t finish a survey or skipped a few questions are usually removed from the set. The best way to clean the data is to have pure data from the beginning. How to do that? Conducting a pre-study can determine whether respondents who are going to participate in the study are the right ones.
Asking pre-study questions via UXtweak looks like this:
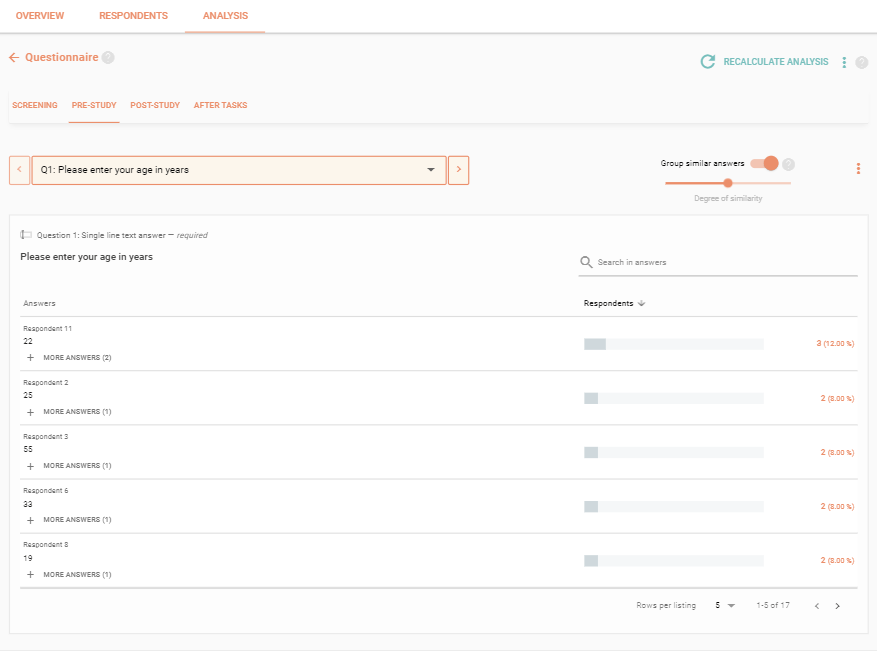
Adding a screener is also a great way of filtering out the respondents irrelevant to a study. This will help you get clean results from the beginning and only focus on the answers that matter, the ones of your target audience.
To give an example of a screening question, let’s say you’re testing a website with goods for toddlers. A great screening question would be: “Do you have at least one child under 10 years old?”. By asking this question you’re automatically eliminating people who don’t have kids from the test.
3. Find a proper methodology
Find methods that will allow you to understand your users. What kind of method has the potential to explain the data? Is it overwhelming? Don’t worry, we will give you few tips on what to do with that scary data.
4. Is it significant?
Statistical significance can be understood as some kind of confidence, that what you found in data is real and not just some kind of guessing. Therefore, changes that you make to your design will have an impact. You are simply looking for significant results.
5. Dig into the past
It can be helpful to compare data with the previous studies and see if there is improvement or decline. This way you can see the data in the bigger picture. Suddenly, your data will have meaning. They are not only numbers.
6. Take qualitative data into consideration
Many researchers are primarily preferring quantitative data. It is always nicer when you present reports with numbers and graphs. On the other hand, qualitative data can give you a valuable perspective on the design.
Qualitative data can support you and navigate in the identification of users’ issues. Research can be also very valuable when improving user onboarding with qualitative data.
7. Correlation does not imply causation
If I ever get a tattoo, this will be it: Correlation does not imply causation. I will explain it on my favorite simple example:
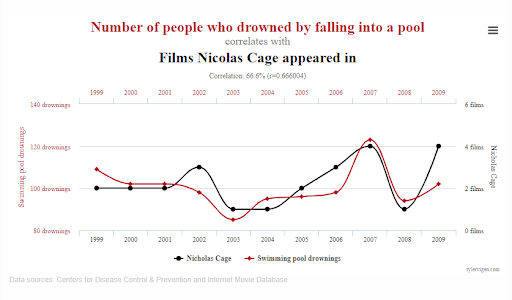
When you put the number of films with Nicolas Cage and the number of people who drowned, those two can be somehow connected. Even though they are correlated, it doesn’t mean that one factor is causing the other.
6 tips on how to start analyzing the data
So far we discussed where to begin and what steps you should follow to analyze the survey data. Now we will tell you what tools and methods you can use. The methods that we mentioned are very simple and easy. Don’t forget: There is beauty in simplicity.
Compare responses to see what is happening
One of the most useful ways for understanding your users is to ask questions with multi-options. You can ask for instance, how they found initial information about your company. Was it from ads, Facebook, Instagram, their friends? It is helpful to add the overall number of users who answered a question for every answer in the range or answers.
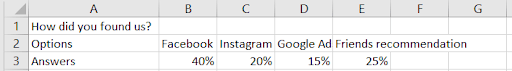
Results are sometimes easier to understand when you present them in graphs. 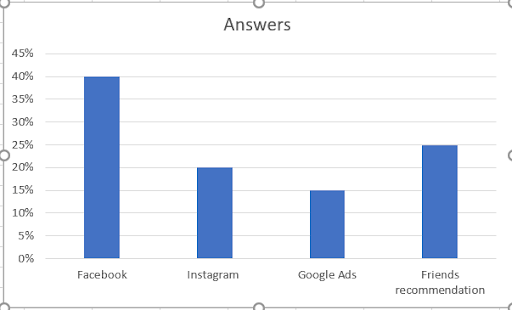
UXtweak has a handy feature of visualizing most of the data obtained from the study in the form of graphs, charts and tables. They are easier to read and analyze and are a lot more pleasant to share with stakeholders when presenting study reports.
You’ll find those charts in the Overview Page and the Analysis Page of the study results. They will be there when you’re doing a survey but also in any other type of UX research study where you decide to include a question such as a screener, pre-study or a post-study question.
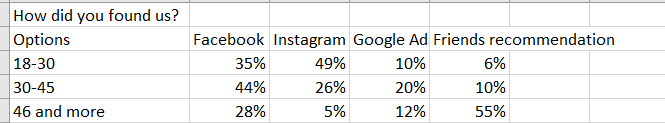
Put your respondents into the boxes
Think about the question you asked and categorize your users into groups with the same interest.
Pie charts and bars
When you want to find your users’ opinions about something, you can use questions with a scale of answers. There are various questions that you can ask. We are talking about questions like: How do you like XY, Are you satisfied with the service? and the answers are usually from 1-5, from poor to very good.
The most helpful way to present data is through bar charts or pie charts. Excel or Google sheets are offering you options to create various charts. It is easy and effective. Even though your younger sibling can do that.
What is your mode?
The mode is a concrete value that is the most often within the data set. Here is a simple example:
Lets say your data set contains numbers: 4,5,6,3,4,4,9,4,7,7. The mode is 4 because it appears in the set of values from data the most often. Note, that you can also have two modes, meaning two numbers may appear the most often. It can also happen, that you have a data set like:6,8,12,15,18,19,25,27. Don’t worry, we won’t let you drown. What you can do is group your items.
For example:
0-10 (6,8)
11-20 (11, 12,15,18,19)
21-30 (25,27)
Therefore, group 11-20 appears the most often, and within the group, the number 15 is your winner.
Calculate your mean
When you are counting mean, you are looking for the average, meaning you want to know the exact value that is the most common from your set. How to calculate the mean?
It is easy:
The sum divided by the count gets the mean.
Let’s say you have numbers: 1,2,5,3,5,5
You can count it like this:1+2+5+3+5+5=21 and 21/6=3.5
Analyze, compare and understand data
We did a few quick calculations and you have concrete numbers in our hands. It is important to put the data into context. Is this particular number positive or not? Look for standards, general criteria in the field. Compare your data to standards.
Let’s say that you are looking at the average page load time for your website and it is around 10 seconds. Great, but what does it mean? When you google information about the average page load time for desktop in 2021, you will probably find out that it is 10,3 seconds based on websitesetup.org. Now it all makes sense.
Analyze survey data without a headache
We understand your concerns. Imagine that you finished the study and now you have tons and tons of numbers, letters and responses. You already feel anxious, but you don’t have to. Think about your initial goal first, before you analyze survey data. What is it that is critical, what you want to find out?
To make your life easier, think about analysis before conducting the study. Find an online survey tool, write down your questions and see your results in the report. It is that simple.
If you feel like a pro, Excel, Google Sheets or programs for Statistics will do their job. For a more pleasant and insightful experience, however, we recommend running the survey with UXtweak and letting it automaticallyanalyze half the data for you!