
Key Takeaways
🐝 The top reviewed mobile app analytics tools are UXtweak, Glassbox and Google Analytics.
⚙️ Mobile app analytics tools are crucial if you want to provide good app UX, improve engagements, and optimize your apps’ performance.
❗️The main challenges with choosing the right tools are privacy and compliance issues, integration difficulties and tracking accuracy.
Understanding the role that mobile app analytics play in driving product growth and engagement is crucial. In this article, we evaluate the top 11 mobile app analytics software that will help you delve deep into user behavior, preferences, and patterns.
What are mobile analytics tools for?
With the rise in the number of mobile applications in the market, competition has become very fierce. Only those who have a comprehensive understanding of how users navigate and engage with their app will truly stand out. Mobile app analytics tools help you to easily track specific user actions, identify areas for improvement, and gain real-time insights into user interactions.
These tools offer solutions to UX and product teams that want to use data to make informed decisions and improve their app’s performance and user experience.
Top 12 Mobile App Analytics Software & Tools for 2026
We have provided a list of the top 12 mobile app analytics software and tools that will help you gather, measure, and analyze various data points in user behavior.
- Firebase
- UXtweak
- Appsflyer
- Smartlook
- App Radar
- Mixpanel
- Flurry
- Google Analytics
- Countly
- Amplitude
- Glassbox
- UXCam
We use a table to present a quick overview of pricing, reviews, and support options from Capterra:
Rating | Ease of Use | Quality of Support | Pricing | |
Firebase | 4.3 | 4.3 | ✓ Free plan Business plan starts at $107 per month. | |
UXtweak | 4.8 | 5.0 | ✓ Free plan Business plan - $107/month, billed annually | |
Mixpanel | 4.0 | 4.3 | ✓ Free plan Pricing available upon demand. | |
Smartlook | 4.8 | 4.5 | ✓ Free plan Paid plan starts at $55 per month. | |
App Radar | 3.9 | 3.8 | ✓ Free plan Paid plan starts at $69 per month. | |
Flurry | 4.0 | 4.0 | It is a free tool. | |
Google Analytics | 4.1 | 4.1 | It is a free tool. | |
Amplitude | 4.1 | 4.3 | ✓ Free plan Paid plan starts at $995 per month. | |
UXcam | 4.8 | 5.0 | ✓ Free plan Pricing available upon demand. | |
Countly | 4.5 | 5.0 | ✓ Free plan Paid plan starts at $69 per month. | |
Glassbox | 5.0 | 5.0 | ✗ No free plan Paid plan starts at $15,000 annually. |
1. Firebase
Best for: Android, iOS, and web applications
Firebase is mobile analytics software powered by Google that provides the infrastructure to help you grow and build your customer base on Android and iOS platforms. With the ability to run analytics on your mobile app, Firebase also offers solutions for building “serverless” applications, monitoring app performance with the ability to detect crashes, and increasing user engagement with A/B testing and live messaging in one Hub.
Key features
- Ads Tracking – measure user engagement with ads and improve the effectiveness of your campaigns.
- Ads Revenue – analyze income from in-app ads and optimize monetization.
- In-app Analytics – use insights into user behavior to enhance UX.
- Crash reporting – Firebase helps identify, analyze, and alert developers about app crashes, helping improve app stability.
- A/B testing – test different app versions to optimize user experience.
- Live messaging – send real-time messages to users to improve engagement.
User reviews & rating
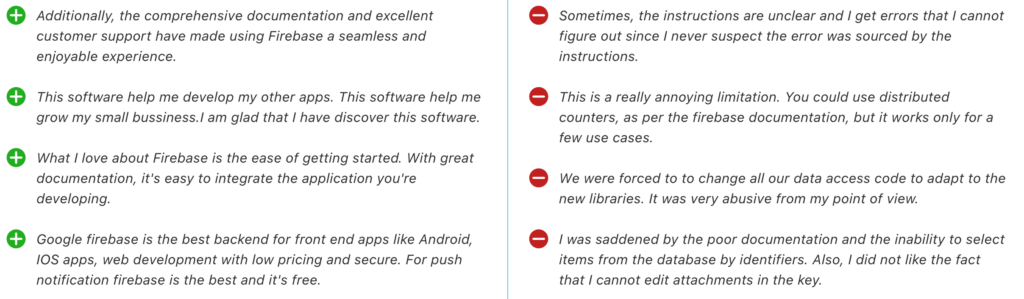
Firebase has an overall rating of 4.6/5, according to Capterra. Here is what users say about the tool:
Pros
- Has an excellent customer support.
- Has a comprehensive documentation system.
- Utilizes cloud databases for storage in the software
- Simple to manage and great infrastructure for hosting applications
Cons
- Unclear instructions when encountering errors.
- SQL database is not available on Firebase.
Pricing & Plans
Firebase helps you to grow and build your customer base on Android and iOS platforms for free with its free plan. They also have a paid plan that starts at $5 per month.
2. UXtweak
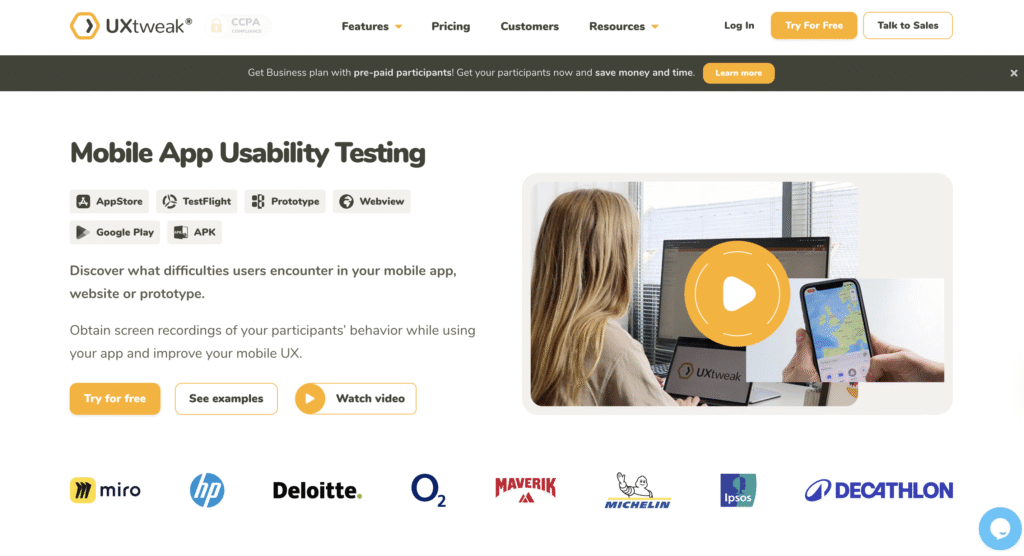
Best for: Android, iOS, web applications, and websites
UXtweak is a complex UX research tool with a robust mobile testing and heat mapping tool, with scroll maps, click maps session recording, and in-depth analytics, that product teams can use to analyze the experience their users have while interacting with their apps. UXtweak also offers a range of usability testing tools, that allow you to spot and analyze the issues users encounter when using your app.
This tool is perfect for analyzing and improving the UX of your mobile app and is great on its own, as well as in combination with other mobile app analytics tools.
Key features
- Mobile Testing – test the mobile usability of your application, find improvement areas, and enhance app UX.
- Session Recording & Heatmaps – analyze where users interact with your app the most, adjust confusing elements.
- Prototype Testing – conduct prototype testing for new app features and layouts to avoid redesigns.
- Card Sorting & Tree Testing – create intuitive app information architecture for better navigation
- Preference Test – choose design options that work best for your users.
- Five–Second Test – analyze the first impression your app leaves.
- First Click Test – examine if the user’s first click leads in the right or an unexpected direction.
See UXtweak tools in action in these demos 👇
User reviews & rating
UXtweak has an overall rating of 4.8/5, according to Capterra. Here is what users say about the tool:
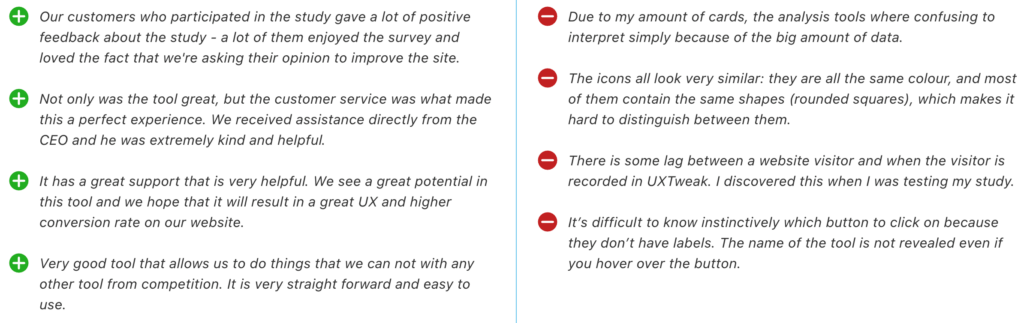
Pros
- Has a robust mobile testing tool
- Has advanced analytics that is easy to read
- Ability to run Heat maps and session recordings on mobile app
- Intuitive UI and easy set-up
- Has over 155M+ user panels to recruit participants.
- Offers all the tools you need in one place
- Has a free plan
Cons
- Supports only 10 languages.
Pricing & Plans
UXtweak has designed a variety of pricing plans to suit different user testing requirements:
- Free Plan (€0/month) – Forever free, a great way to experiment with UX research tools at no cost. Includes access to all tools, 15 responses/month, 1 active study, and 14-day access to results.
- Business Plan (€92/month, billed annually) – Ideal for teams that require essential UX research tools and features for their projects. Includes 50 responses/month (upgradable), 1 active study (upgradable), unlimited tasks per study, 12-month data retention, reports and video exports.
- Custom Plan (Pricing upon request) – Tailored for organizations with advanced research needs, providing unlimited active studies, customizable responses, live interviews, access to a global user panel and much more.
For more information on the features of each plan, visit the UXtweak pricing page. 🐝

3. Appsflyer
Best for: Android, iOS
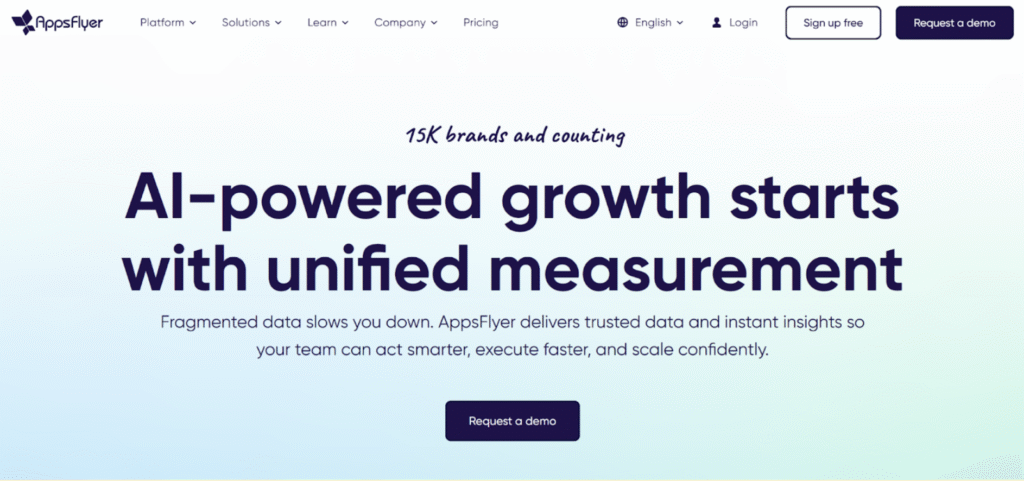
Appsflyer is a marketing analytics and attribution platform that performs as a central hub for tracking, measuring, and optimizing mobile app campaigns. With real-time attribution insights, Appsflyer helps your team identify which marketing efforts truly drive growth, which channels attract the most valuable users, and where your budget should actually go based on data rather than intuition. If you’re scaling app marketing or trying to figure out what’s actually moving the needle, AppsFlyer gives you the data to make those calls confidently.
Key features
- Attribution Tracking – measure the performance of campaigns across multiple channels.
- Audience Segmentation – build detailed user segments to deliver more high-converting campaigns.
- ROI Measurement – monitor ad spend and returns accurately.
- Fraud Protection – detect and block fraudulent installs and clicks.
- Deep Linking & Engagement – create seamless customer journeys from ads or social campaigns.
User reviews & rating
Appsflyer has an overall score of 4.5/5, according to Capterra. Here is what users think about this tool:
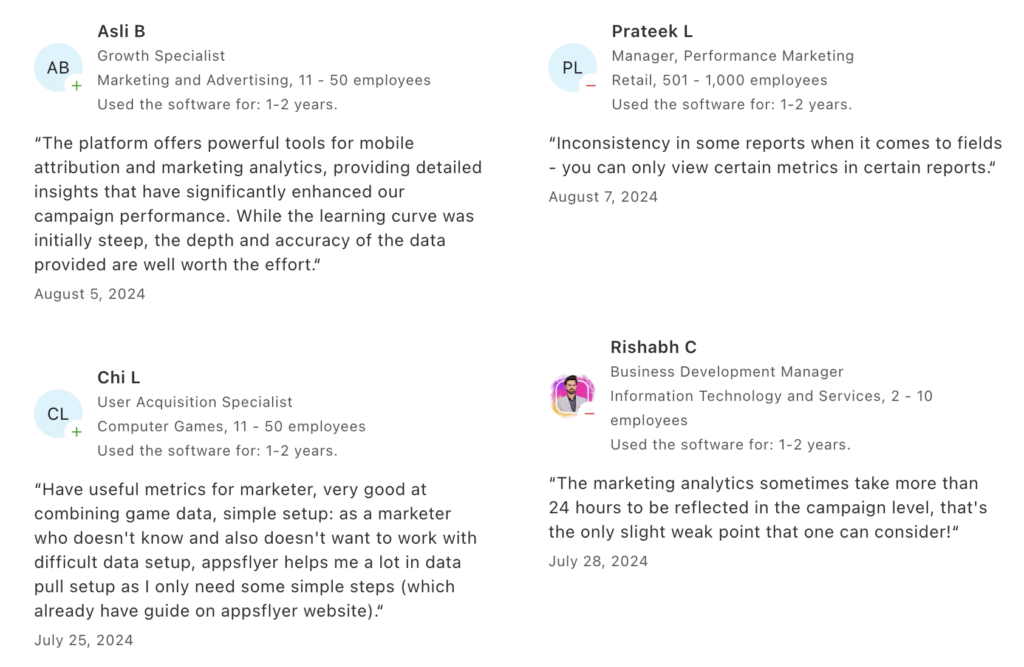
Pros
- Provides accurate attribution tracking.
- Offers strong data privacy and fraud protection features.
- Integrates with many marketing and analytics tools.
- Delivers detailed insights for user acquisition and retention optimization.
Cons
- Can be costly and complex for beginners.
- Need technical setup for full capabilities.
Pricing & Plans
Appsflyer offers a free plan with basic attribution tracking features for smaller apps. Once you outgrow that or need deeper analytics, pricing gets customized based on your app’s size and what you’re trying to do. Expect the cost to scale with your monthly active users and the features you add on.
4. Smartlook
Best for: Android, iOS
Smartlook is a qualitative mobile analytics software that helps you find valuable customer insights, such as where they click, which features they like, why they churn, what bugs and glitches they experience, and more. Smartlook has SDKs that run on 10 native mobile apps and game platforms and frameworks — including Android, iOS React Native, Unity, Unreal Engine, etc.
Key features
- Session Recordings – identify behavior patterns and confusing elements.
- Event Tracking – track clicks, taps, and page visits.
- Funnel Analysis – analyze user journeys to identify where you lose customers.
- Sensitive Data Protection – Smartlook masks private data, such as passwords and personal information, helping you adhere to privacy regulations.
- Heatmaps – analyze where users click the most.
User reviews & rating
Smartlook has an overall rating of 4.7/5, according to Capterra. Here is what users say about this mobile analytics software:
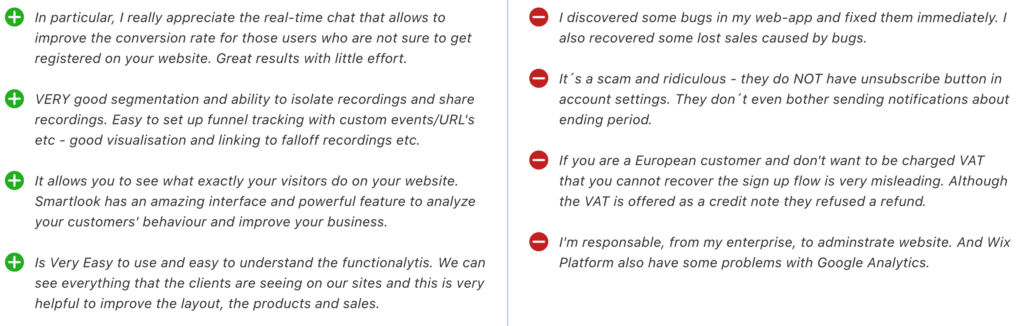
Pros
- Supports mobile platforms and frameworks on Android, iOS, React Native, Flutter, Unity, Unreal Engine, and Cocos.
- Has an administrative panel that helps you to manage client accounts.
- Has a robust system that delivers accurate qualitative data.
- It is accessible for free.
Cons
- Inability to organize session recordings into folders or tag them according to user participant.
- Inability to view recordings in a pop-up window or a panel on the same screen.
Pricing & Plans
Smartlook allows you to use qualitative analytics to enhance the performance of your app with its free plan. They also have a paid plan that starts at $55 per month.
4. App Radar
Best for: Android, iOS
App Radar is a mobile analytics and app marketing platform that offers keyword tracking and research functionality, that helps you gain keyword and market intelligence. App Radar runs analytics that provides you with key metrics tracking, localization, keyword rank tracking, and keyword research tools on Android and iOS mobile apps.
Key features
- Market Intelligence – get insights into market trends and benchmarks, and competitors’ strategies.
- Keyword Intelligence – optimize the app visibility and discoverability in stores.
- ASO Workflow – optimize workflow with task management and collaboration.
- Ratings & Reviews Management – collect and analyze what users say to improve the app’s reputation.
- App Store Performance Tracking – monitor KPIs such as downloads, rankings, and conversions.
- Ad Performance Tracking – track the effectiveness of paid ads campaigns.
User reviews & rating
App Radar has an overall score of 3.9/5, according to Capterra. Here is what users think about this app analytics software:
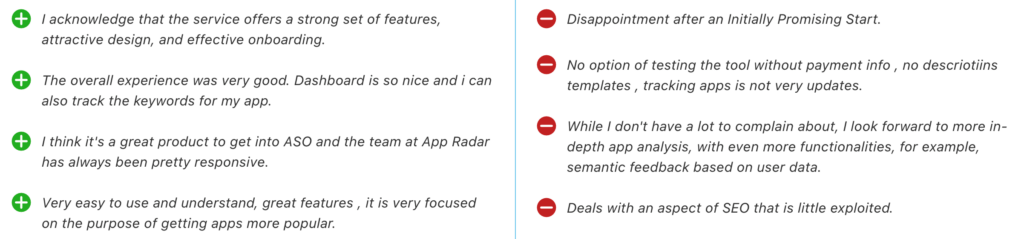
Pros
- The UI is very easy to use and understand.
- Has a great functionality that helps apps rank higher.
- Ability to track important keywords across any application
- Has a strong set of features and an effective onboarding
- It has an optimized feature that helps with user acquisition and provides Instant Optimization Score feedback.
Cons
- Lacks in-depth app analysis eg. semantic feedback based on user data.
- Inability to customize reports.
- Metrics like downloads and impressions are not readily available.
Pricing & Plans
App Radar helps you to learn how your app is being discovered with its free plan. They also have a paid plan that starts at $69 per month.
5. Mixpanel
Best for: Android, iOS, and web applications
Mixpanel is a user insights and mobile analytics platform that provides interactive reports that enable product teams to analyze user behavior as they engage an application. This tool helps product teams to measure what matters, make decisions fast, and build better products through data. Mixpanel takes a different approach than other platforms by analyzing not only page views on screens, it measures the actions or steps taken by users and potential customers visiting the product application while being monitored.
Key features
- Interactive reports – customizable, real-time reports with filtering and various visualization options.
- Team boards and Alerts – send alerts for critical changes and collaborate through dashboards.
- Limitless segmentation – segment your users for a more in-depth analysis.
- Group Analytics and Insights – measure engagement across different user cohorts.
- Data Integration and Management – integrate data and tools, such as Google Tag Manager, Stripe, Shopify and others.
User reviews & rating
Mixpanel has an overall score of 4.5/5, according to Capterra. Here is what users say about this app analytics platform:
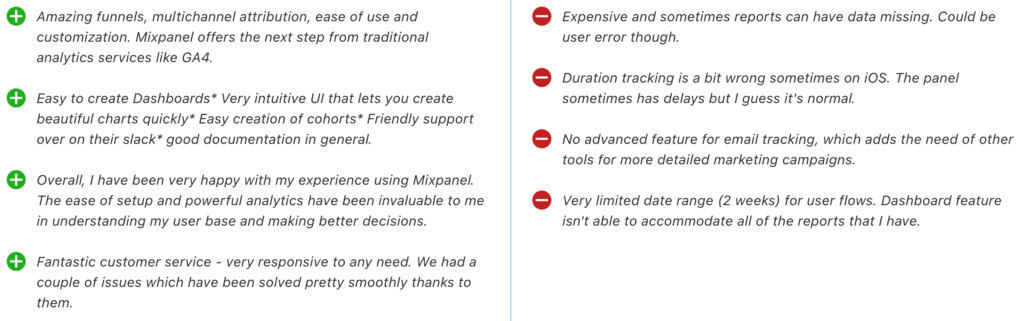
Pros
- Track and analyze user behavior on mobile applications.
- Very intuitive user interface.
- Easy to use and quick to get started.
- Offers powerful integrations with platforms such as Google Cloud, Optimizely, Zoho, and Slack
Cons
- Some statistical data are not available
- Does not send surveys to customers directly in-app
Pricing & Plans
Mixpanel has a free plan that is available for up to 100,000 tracked users. They also have a paid plan that starts at $20/month.
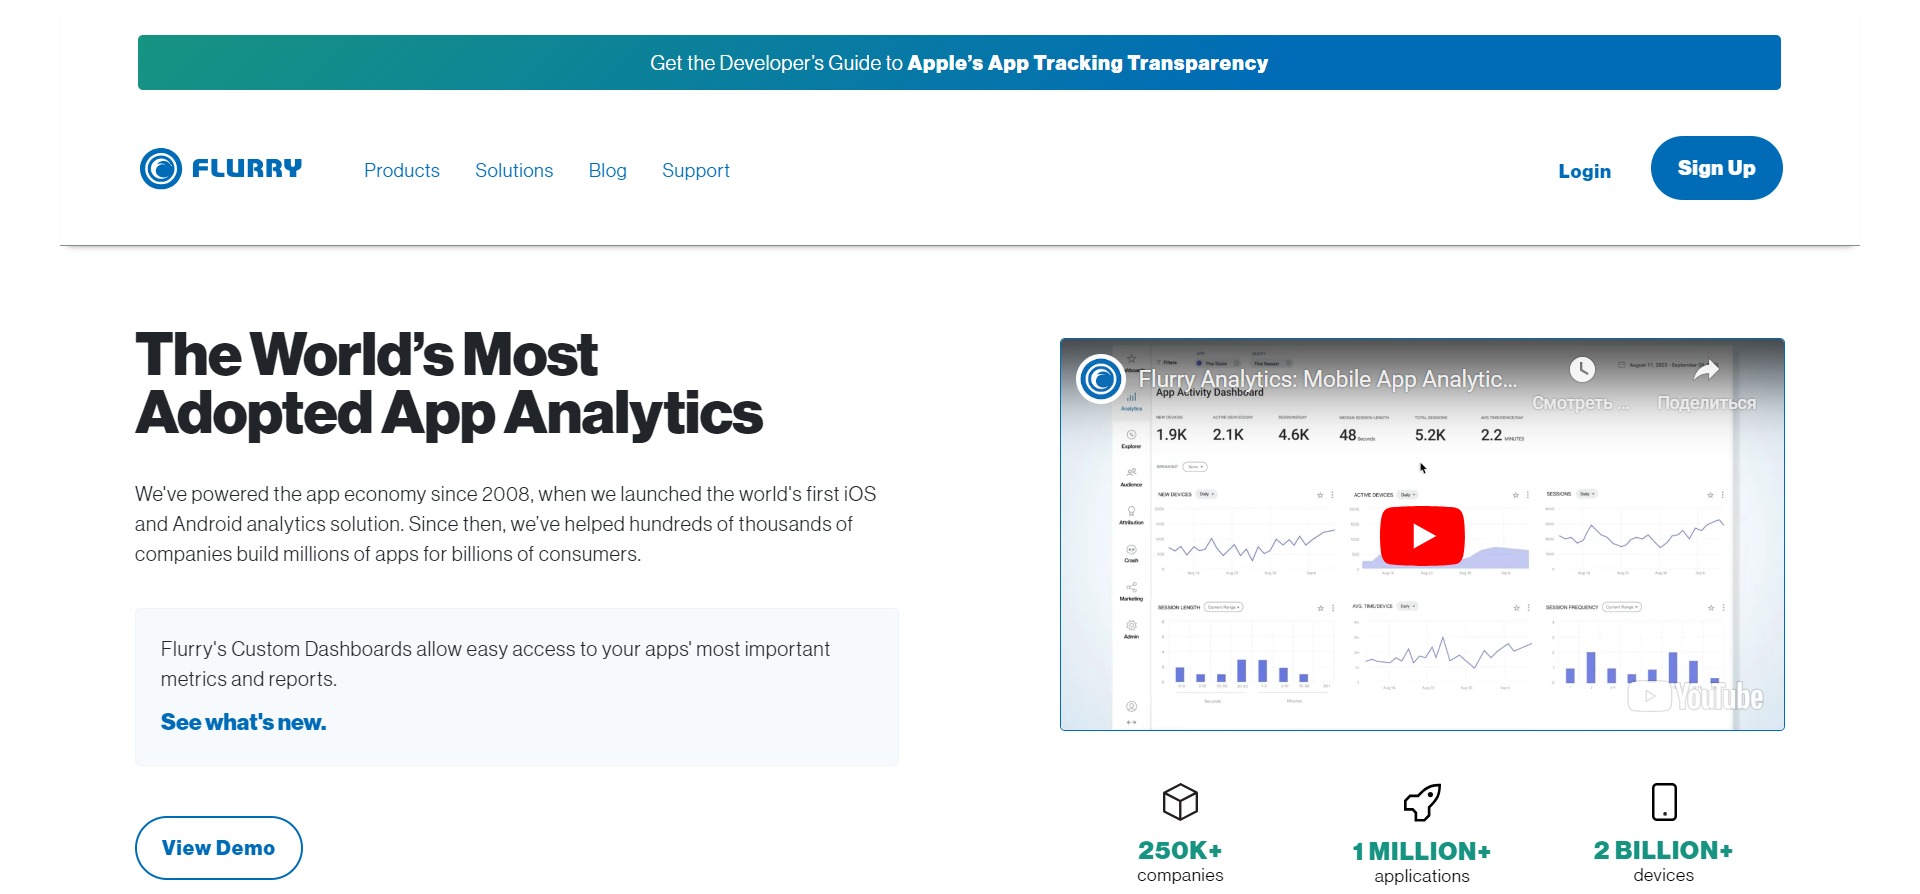
6. Flurry
Best for: Android, iOS
Flurry is a mobile analytics software that allows you to track new users, and active users, recording sessions, with efforts to measure and analyze their activity across an entire application (including crash and user acquisition analytics). It is a completely free tool that helps you track user interactions and understand user behavior.
Key features
- Funnel and Event Tracking – identify drop-offs and optimize conversion paths.
- Crash Reporting and Analysis – detect crashes, and create and analyze reports for future prevention.
- Raw Data Export – access raw performance data for more in-depth analysis.
- User Segmentation and Journeys – segment users based on various characteristics and optimize engagement strategies.
User reviews & rating
Flurry has an overall score of 4/5, according to Capterra. Here is what users say about this tool:
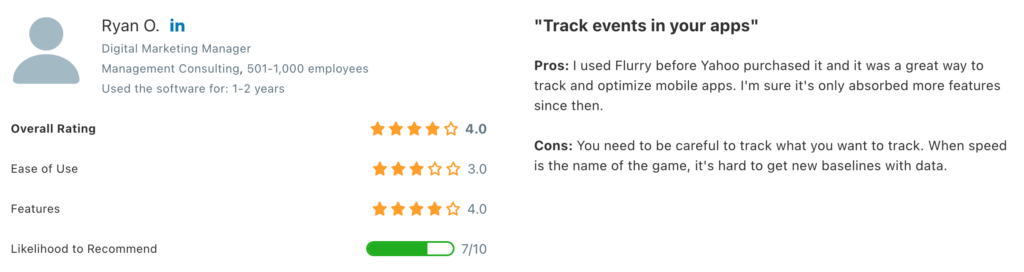
Pros
- Ability to identify bugs within app using crash reports.
- Has an easy-to-use user interface
- It is a completely free tool.
- Gives you information on user journeys and allows you to segment this information by country and devices.
Cons
- Does not integrate well on iOS app devices due to restrictions.
- Does not offer real-time reporting
Pricing & Plans
Flurry helps you to measure and analyze user activity across an entire application for totally free. It is a free tool.
7. Google Analytics
Best for: web applications
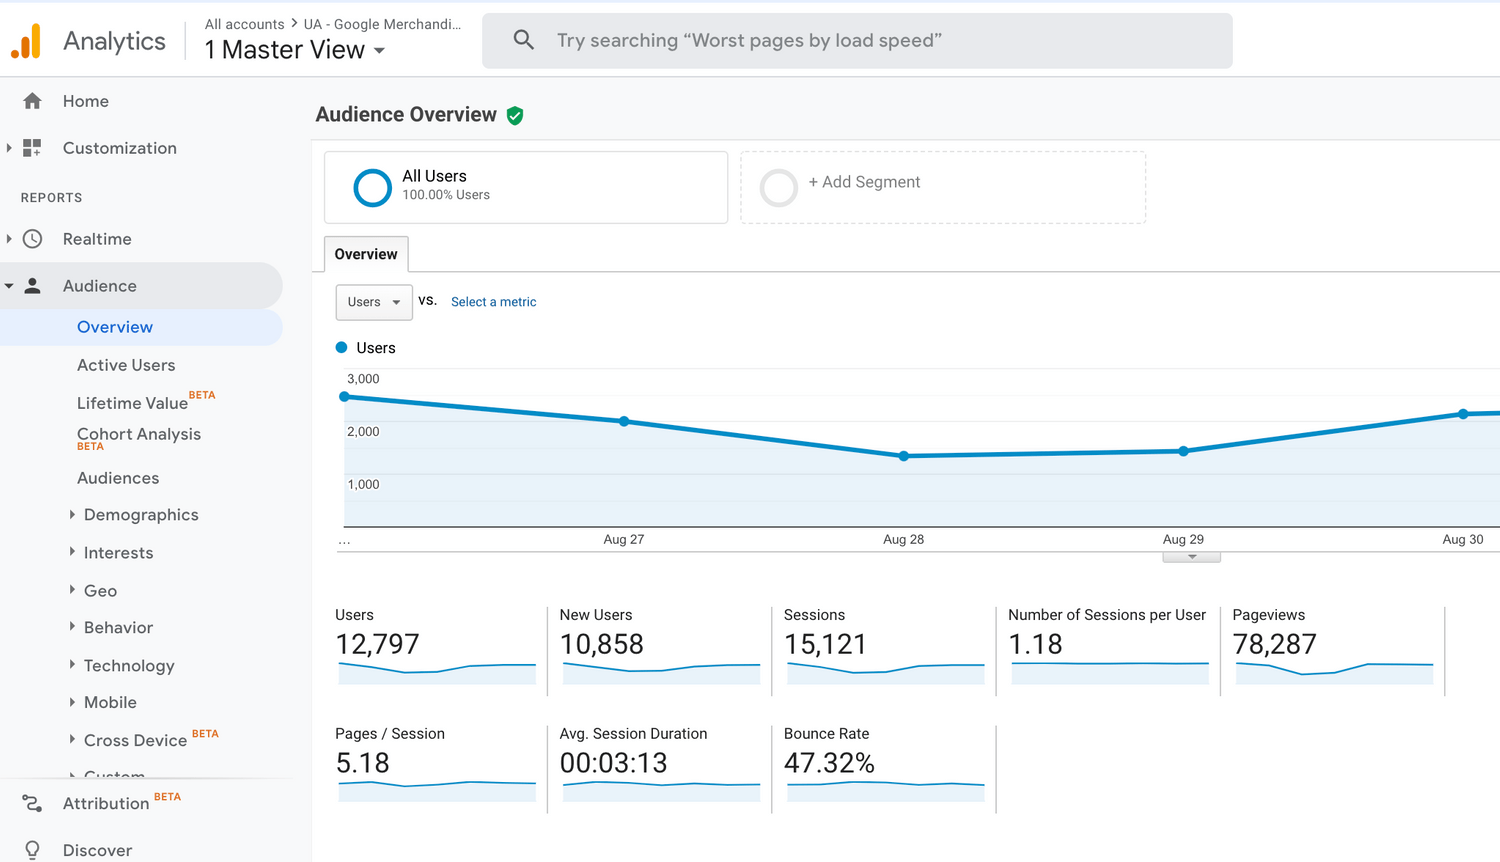
Google Analytics is a user insights and mobile analytics platform that provides insights into user behavior and interactions within applications to identify effective content by tracking and reporting active app user traffic.
Google Analytics uses advanced analytics and unique insights to discover user trends and patterns in the data. It identifies users with high revenue potential and identifies content that converts the most customers. By analyzing your mobile app’s performance, including how users interact with your app, you can evaluate and optimize your UX, mobile app copy, and CTAs that elevate the user experience (UX).
Key Features
- Google unique insights – use Google’s machine learning to get automatic insights, trend predictions, and anomaly detections.
- Automation and analytics – for a simplified data interpretation.
- Advertising Workspace – integrate with Google Ads and other tools to optimize campaign performance.
- Data Collection and Management – gather user data across different apps.
- Advanced-Data Governance – manage user privacy with controls for data retention, access and compliance.
User reviews & rating
Google Analytics has an overall score of 4.7/5, according to Capterra. Here is what users think about this tool:
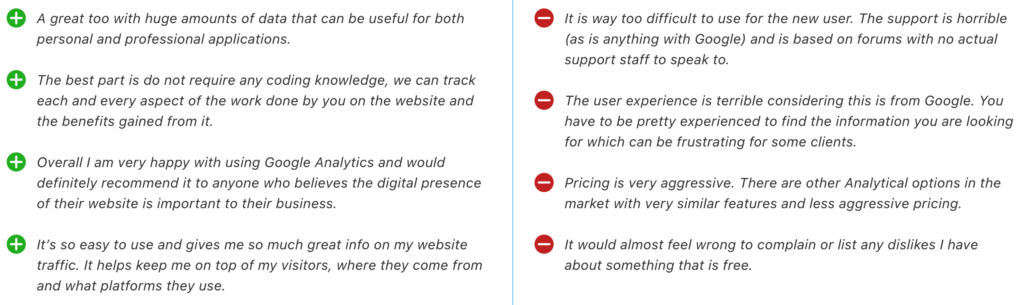
Pros
- Track customer engagement metrics with advanced analytics and unique insights
- Ability to log into multiple accounts at once
- It is flexible and adaptable to various industries and business models
- Very easy to use
- It processes data extremely fast.
Cons
- Some features are not applicable in some countries overseas
- Troubleshooting takes a while when conducted alone.
Pricing & Plans
Google Analytics helps you to track and analyze user behavior on mobile applications for free. It is a free tool.
8. Countly
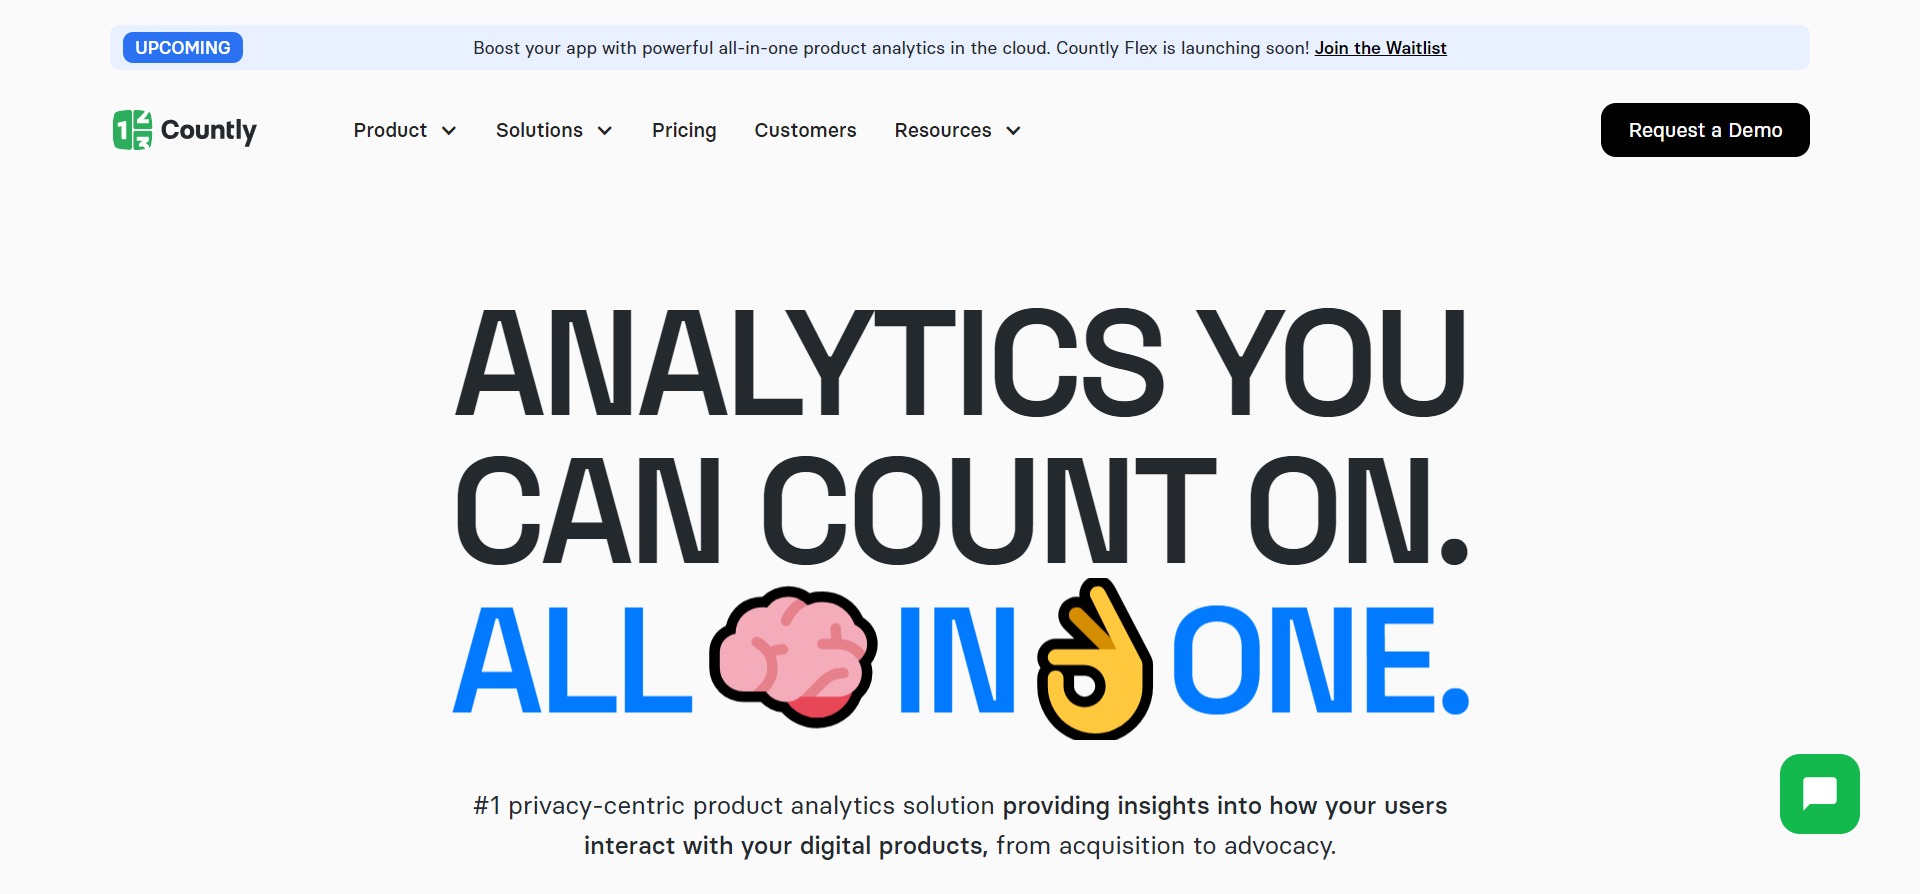
Best for: Android, iOS, web and desktop applications
Countly is a mobile app product analytics platform that allows you to measure and optimize your app’s performance. You can track real-time metrics like active users, time spent in-app, and user location by integrating their SDK into your app. It has a robust plugin marketplace for user profiles, advanced segmentation, behavioral cohorts, automated push, remote configuration, A/B Testing, and Crash Analytics that help to deliver a customized customer experience, and a successful user journey for users while maintaining customer data privacy.
Key Features
- Revenue Analytics & Retroactive Funnels – track revenue events and user behavior to optimize conversions.
- Countly Drill (advanced segmentation) – filter user information with advanced segmentation.
- User Profiles – store use data, such as tracking actions and preferences.
- Behavioral Cohorts – Countly helps you group users based on their behavior to analyze how you can improve retention and engagement.
- Remote Configuration – update app settings remotely.
- A/B Testing – compare different versions of your app with users.
- Crash Analytics – catch and analyze any app crashes to prevent them in the future.
User reviews & rating
Countly has an overall score of 4.6/5, according to Capterra. Here is what users say about this app analytics software:
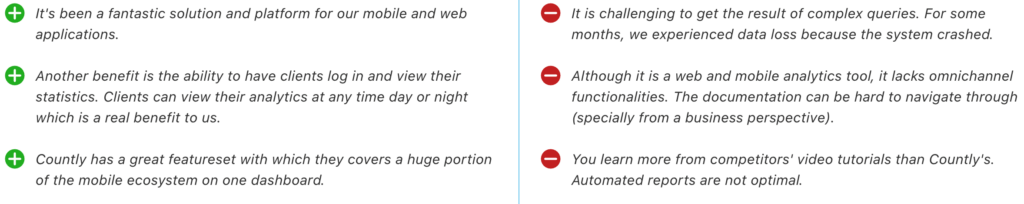
Pros
- Ability to configure analytics dashboard
- Can collect and display only the type of data you want
- Ability to manage mobile app performance
- Push notifications and user profiles that help to improve user customer engagement and boost retention
Cons
- It can be challenging to get feedback results from complex queries.
- It lacks omnichannel functionalities.
Pricing & Plans
Countly provides insights into how your users interact with your app with its free plan. They have a paid plan that starts at $69 per month.
9. Amplitude
Best for: Android, iOS, web applications
Amplitude is a mobile analytics software with cross-platform user journey tracking, user behavior analysis, and segmentation capabilities that help product teams and businesses see every path a user takes within an app in a single view and zoom in order to understand the context and intent behind their actions.
Amplitude’s product and behavior analytics feature answers complex product questions like, which activities keep users coming back? What is the impact of your latest release? Etc.
Key Features
- Audience Management & User Segmentation – for targeted analysis and personalization.
- Behavioral Graph – map users’ actions across their user journey
- Data Governance – Amplitude helps you ensure data consistency and accuracy.
- Retroactive funnels – analyze past user interactions to optimize conversion paths (without prior setup).
- Scalable analytics – Amplitude can handle large datasets for analysis.
User reviews & rating
Amplitude has an overall score of 4.6/5, according to Capterra. Here is what users think about this mobile app analytics platform:
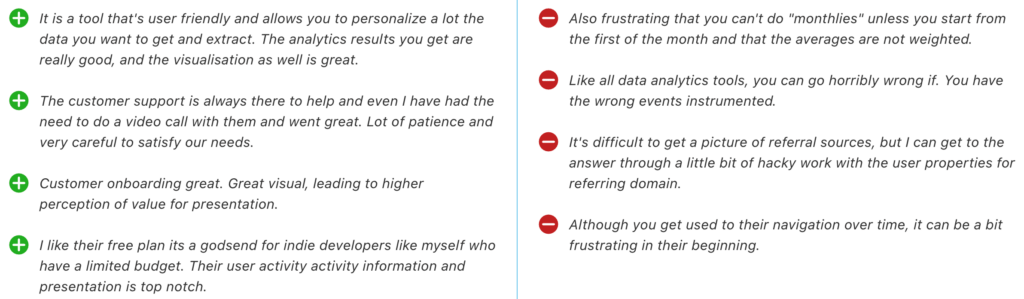
Pros
- Easy to deploy for mobile app analytics.
- Ability to measure product and marketing metrics effectively
- Very quick data visualization capabilities
- Has a seamless and intuitive user interface
Cons
- Setting up events to track can be tough.
- There are some limitations in the “join” functionality when grouping multiple events
Pricing & Plans
Amplitude helps you to track user journey and behavior analysis on your app with its free plan. It has a paid plan that starts at $995/month.
10. Glassbox
Best for: Android, iOS
Glassbox is a mobile app analytics software that helps you record, replay, and analyze mobile app sessions to understand what customers/visitors do on your mobile app, digital channels and why. With a focus on journey mapping, Glassbox delivers user insights that fuel customer growth and loyalty.
Key Features
- Session replay – watch and analyze users’ behavior in your application.
- Crash analytics – detect and report app crashes to improve UX.
- Network and device performance – monitor important KPIs, such as HTTP request response times, connection types, CPU usage, etc.
- Interaction mapping – Glassbox helps you visualize users’ journeys, their clicks, paths, and struggles.
- Engagement analytics – analyze engagement metrics, such as session counts, and screen usage trends.
User reviews & rating
Glassbox has an overall score of 4.9/5, according to Capterra. Here is what users say about the tool:
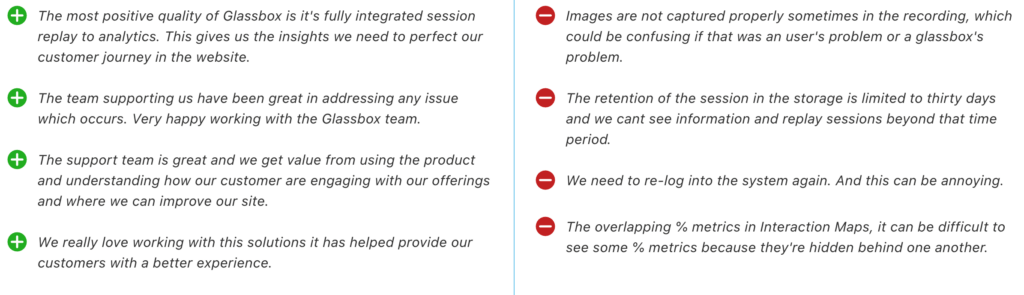
Pros
- Ability to analyze friction points in an app due to its level of data capture
- Ability to manipulate data into an easy and digestible format
- Ability to create a thesis before testing
- Session recording helps to identify users’ behavior
Cons
- The Analytics dashboard is not user-friendly
- Difficult to see some metrics due its overlap in Interaction Maps
Pricing & Plans
Glassbox helps you understand what users do on your mobile app and focus on user journey mapping with their paid plan that starts at $15,000 paid annually.
11. UXCam
Best for: Android, iOS
UXCam is a mobile app analytics software that enables you to unlock in-depth insights into your mobile app’s performance. UXCam is designed to give you a deep understanding of user behavior and help you to interpret data. UXCam’s heatmaps reveal the hidden story behind user behavior, unearthing key insights that can help eliminate friction.
Key Features
- In-depth behavior analytics – track taps, swipes, and navigation patterns.
- App performance – monitor app speed, crashes, and loading times.
- User Journeys – map out user paths to analyze what areas can be improved.
- Customizable Dashboards – UXcam provides a flexible reporting tool where you can visualize your findings.
- Implementation in minutes
User reviews & rating
UXcam has an overall score of 4.6/5, according to Capterra. Here is what users think about this app analytics software:
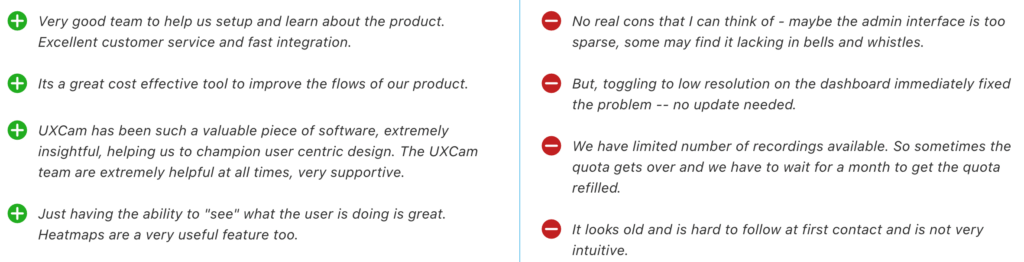
Pros
- Ability to capture all micro-interactions
- Ability to automatically tag activities during session playbacks
- Ability to provide instant insight into customer behavior in the app
Cons
- Has a limited free plan
- Taps are not preserved when videos are exported
Pricing & Plans
UXCam’s mobile analytics show you how users experience your app with its free plan. They have a paid plan that starts at $3000 paid annually.
As your product grows, it becomes more important to monitor your app’s performance. Leverage these analytics tools to improve your application’s UX and meet the evolving needs of their users.
The Best Free Mobile App Analytics Tools
To help you choose the right analytics tool that can fit your budget and suit your needs, we have put together a list of mobile app analytics tools that offer a free plan.
- UXtweak
- Firebase
- Smartlook
- App Radar
- Mixpanel
- Flurry
- Google Analytics
- Countly
- Amplitude
- UXCam
These free analytics tools can play a pivotal role in product and UX teams making informed decisions that enhance user experience and optimize the performance of their mobile applications.
Why are mobile app user analytics tools so important?
Mobile app user analytics tools provide you with the insights needed to better understand your app’s performance and make informed decisions. Generally, all the tools we mentioned in this article will help you:
1. Understand User Behavior
Mobile app analytics tools provide a deep understanding of how users engage with your app. They assist in tracking user actions, such as taps, swipes, and navigation paths, which help you to detect and observe user behavior patterns and preferences.
2. Improve User Experience
After gathering, measuring, and analyzing user data, you can begin to identify pain points and friction areas where users may encounter difficulties. This data helps you to make targeted improvements to the user interface and overall product and user experience, which can result in increased user satisfaction and retention.
3. Enhance App Performance
Mobile analytics tools monitor app performance metrics, such as load times, crashes, and errors. This information enables product teams to identify technical issues promptly and optimize the app for better performance, ensuring a faster and more seamless user experience.
4. Feature Optimization
With the insights obtained from the analyzed data, product teams can determine which app features will be most popular and easily adopted. This insight guides decisions about feature enhancements, updates, and even the development of new functionalities that will align with user preferences.
Ultimately, mobile app analytics tools can enhance your application’s lifetime value and offer an increase in ROI through user analytics data.
Challenges with mobile analytics tools
Although mobile app analytics tools are vital for growth and UX, using them to obtain data might bring challenges. Here are some of the most common one you might come across:
Data overload
Mobile analytics tools will help you gain access to a vast amount of user and app data. The challenge is to properly analyze it and act on the right findings. So, when choosing your mobile analytics software, check if it has automated or advanced analytics features.
GDPR or CCPA compliance
Always make sure your tool gathers user data in a way that complies with applicable law regulations. Especially when obtaining data from new regions, as there might be uncommon laws and regulations.
Cross-platform applicability
Some of the tools we mentioned can be only used for specific platforms, such as iOS or Android. If your app is on many platforms, go for app analytics tools that support that.
What Mobile App Analytics Software caught your eye?
Mobile app analytics tools equip you with the right knowledge and valuable insights that give you the competitive edge to stay ahead of the competition and continually improve your app’s performance and user experience. Choosing the right analytics tool will help you to make data-driven decisions and achieve your business goals faster.
As you conclude on the tool you wish to invest in to improve your app’s performance, see how you can use UXtweak to get access to insights about mobile user behavior. 🐝


📌 Example: imagine you need to conduct mobile testing for your app on both iOS and Android. In this case, you can use UXtweak, as our tool supports mobile testing on both platforms.