
In a typical case of related data, we use dendrograms to help cluster ideas around this data in order to place them in a hierarchical form. This article explores the similarity matrix and its definition, the use of dendrograms for clustering ideas, hierarchy in dendrograms and informing your design decisions using the similarity matrix.
What is card sorting?
Card sorting when done right, helps you to understand the mental models that your users have. It is a user research method that is used to design a more intuitive information architecture of a website or app that puts the user in the front and center of the design decision.
Card sorts are usually carried out by users that help the designer to organize topics and labels into categories that makes sense to them often for the purpose of creating an information architecture that matches these user’s expectations.
It is important to note that card sorting is not only used for designing information architecture and there are other design steps that card sorting would be needed.

Here are some different ways that card sorting can be used:
- Organizing complex information
- Organizing dropdowns and submenus on a website
- Grouping and classifying product labels and titles on an e-commerce website
Card sorting is a highly useful technique in UX that can help you eliminate bias about how you think a product should be structured because when conducted right, card sorting informs how you design content that matches the already existing mental model of your users.
At UXtweak, we put together a card sorting guide that, when followed strategically, will help you design intuitive navigation menus and content structures that will no longer leave your users lost or confused on your website or app.
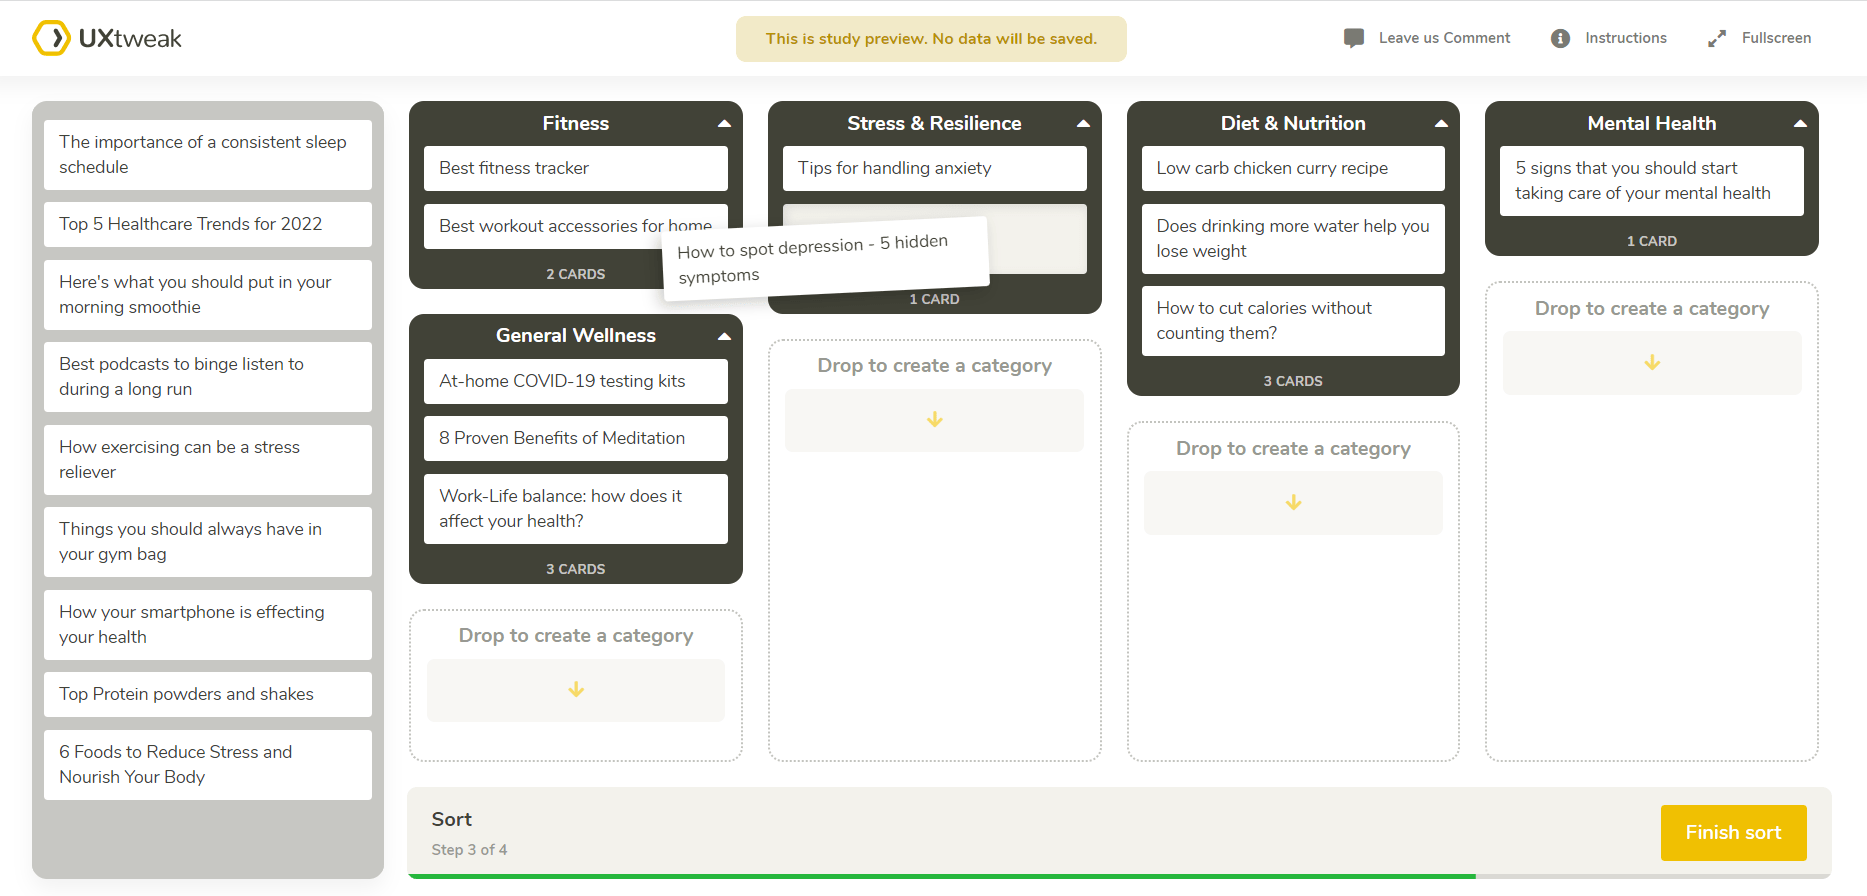
Card Sorting study from the tester’s POV. Source: UXtweak
When a card sorting session is concluded, you are usually left with a lot of data to analyze, interpret and draw insights from and let’s be honest it can be so overwhelming trying to make sense of all the data available to you from your research findings.
This process of data analysis can be time-consuming, especially for projects that are limited in time. However, conducting your card sorting studies with a card sorting online tool like UXtweak helps to make sure that the analysis from the result of your card sorting study is calculated accurately using metrics and aggregations that help to make the outcome of your study easier to interpret than if you were looking at responses one by one.
The insights obtained from the data analysis are also made readily available to you with a good number of statistics and visuals that will help you gauge the insights from different perspectives.
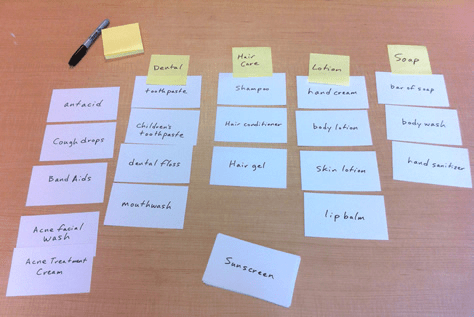
Card sorting with physical cards. Source: Miro
You can also learn how to interpret data and draw insights from a card sorting study on a more comprehensive level by following our how to analyze the results of a card sorting study guide.
Let’s now look at how the similarity matrix plays a big role as one of the important data analysis methods to use when analyzing results from a card sorting study.
But first, we need to define what a similarity matrix is and understand why it’s important in the data analysis of a card sorting study.
What is a similarity matrix
The similarity matrix is a quantitative tool that is used to evaluate the percentage of users who sorted similar cards into the same category. It is often intended to give you a quick insight into the amount of cards that were strongly grouped together by your users.
This method of data analysis is ideal for finding clusters of cards that belong with each other, regardless of what exact categories they were sorted in. The percentage of each grouping is also visually represented by different shades of a particular color. The darker the shade, the more similar the percentage.
You can see a visual representation of a similarity matrix in the image below.
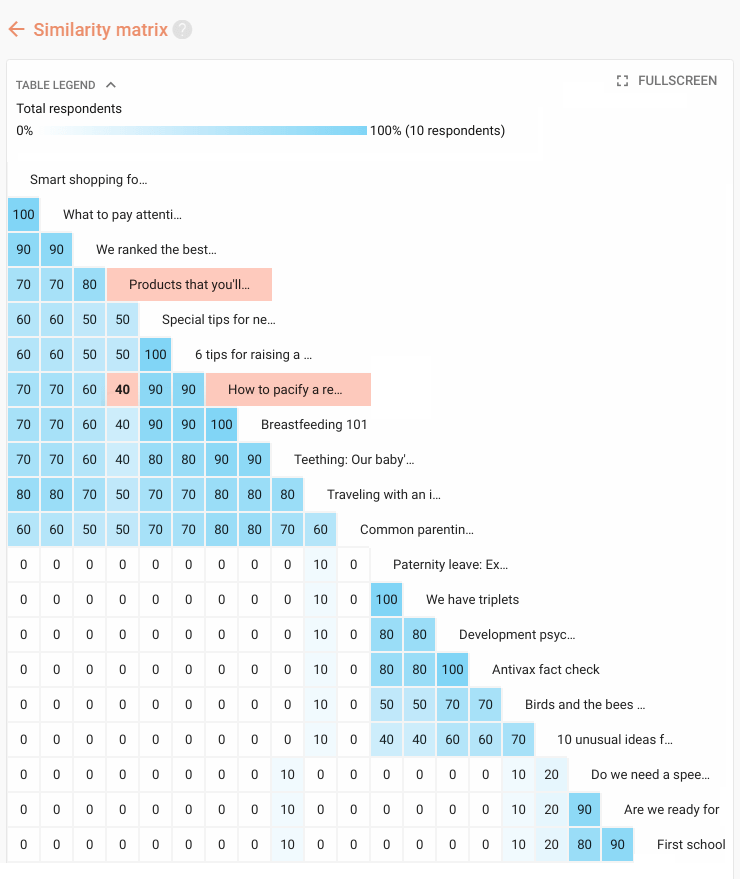
Similarity matrix. Source: UXtweak
Importance of similarity matrix
To evaluate the similarity between two cards, we often use the formula (count in pairing*100) / total tester count. You can learn how strongly each group is related to each other. The matrix shows which cards were grouped together and clusters these similar cards at the edge of the diagonal of the diagram.
Here is what you need to know about similarity matrix in card sorting:
- The similarity matrix provides an easily readable representation of the frequency of paired cards grouped together.
- The higher the percentage and darker the shade of color where two cards intersect, the more often they were grouped together.
- The grouped cards in the matrix display a list of categories that contains the list of respondents who submitted them for easy identification.
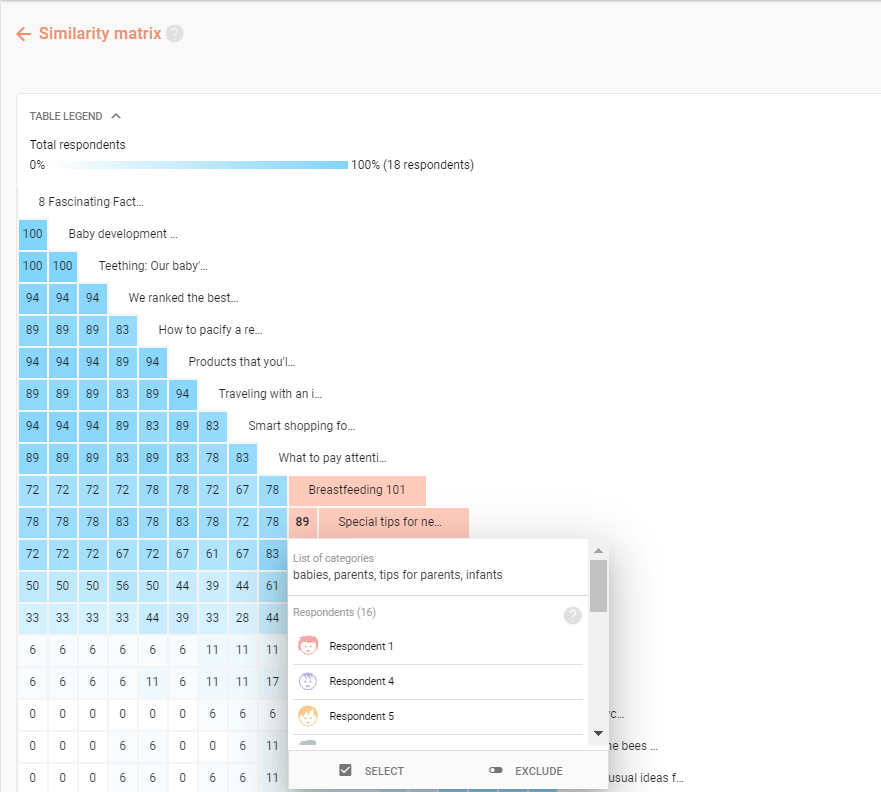
A similarity matrix showing the names of respondents. Source: UXtweak
Now that the similarity matrix has been constructed, where the similarity in our case is based on the volume of topic associations by cards, we can chart the different similarities on a heatmap and visualize which groups of card entries are more likely clustered together.
Another quantitative method of data analysis is a tool called dendrograms which is easily used to illustrate the clusters gathered in the matrix. Let’s briefly look at the definition of a dendogram so that we can understand how to tie these two methods together when analyzing our card sorts.
Dendrograms in card sorting
A dendrogram is a hierarchical representation of a multiple cluster similarity matrix. They often illustrate the number of clusters while showing the relationship between these clusters. When the similarity matrix grows, the dendrogram grows accordingly.
It is often created from hierarchical clustering. Let’s see how dendrograms apply in card sorting. The diagram below shows how these clusters are collated and obtained from the similarity matrix with each tab having a common pattern for a specific category.
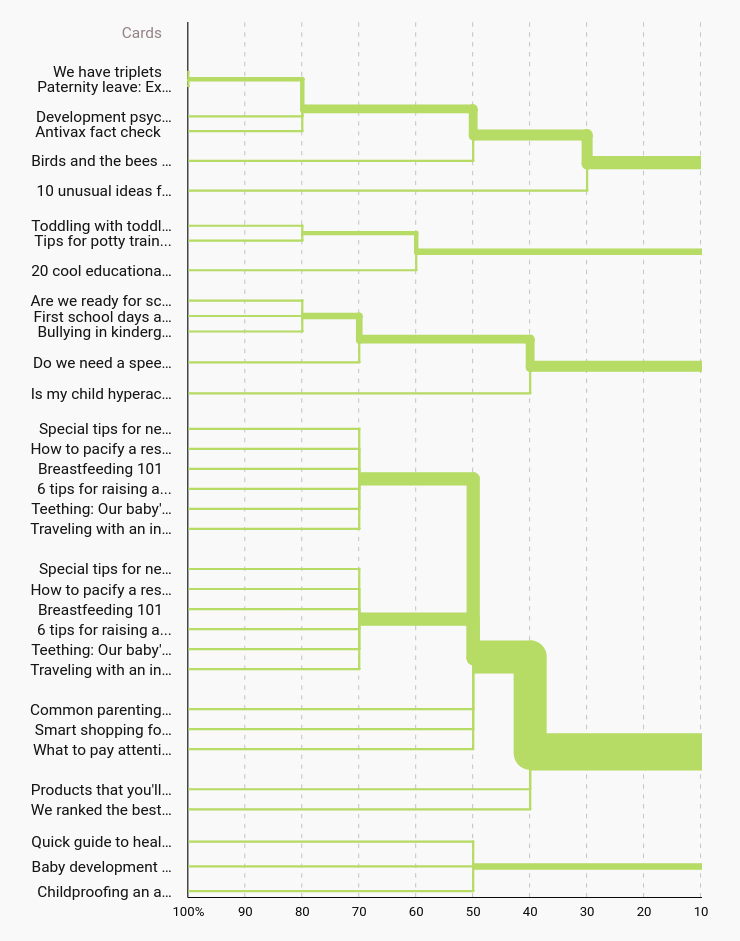
Dendrogram. Source: UXtweak
Dendrograms are often complex and need to be illustrated correctly and accurately from the similarity matrix. A lot of researchers find it difficult to show these illustrations accurately, but luckily UXtweak has a handy guide to help you: how to interpret dendrograms in card sorting.
Use a similarity matrix to inform your UX Decisions
The similarity matrix is just a simple representation of pair combinations, intended to give you a quick insight into the cards your participants and users paired together in the same group the most often.
The clusters are also there to show you related paired cards that belong in the same category and the strongest pair is grouped next to the second-strongest pair that either of the first cards has, and so on.
If you want to start designing easy-to-use and more intuitive information architecture and website content and menus, leverage the similarity matrix as a data analysis tool once you have successfully conducted your card sorting workshop. Use UXtweak’s card sorting tool to automate your card sorting studies and increase the findability and discoverability of key information on your website and app in order to keep your users engaged.