🐝 Heatmapping tools help businesses analyze user behavior, optimize design, and boost conversions.
🌼 Top-rated heatmapping tools include UXtweak, Smartlook, Hotjar, and Lucky Orange (based on Capterra reviews).
🍯 The best free tools are MicrosoftClarity, GoogleAnalytics, UXtweak, and Hotjar.
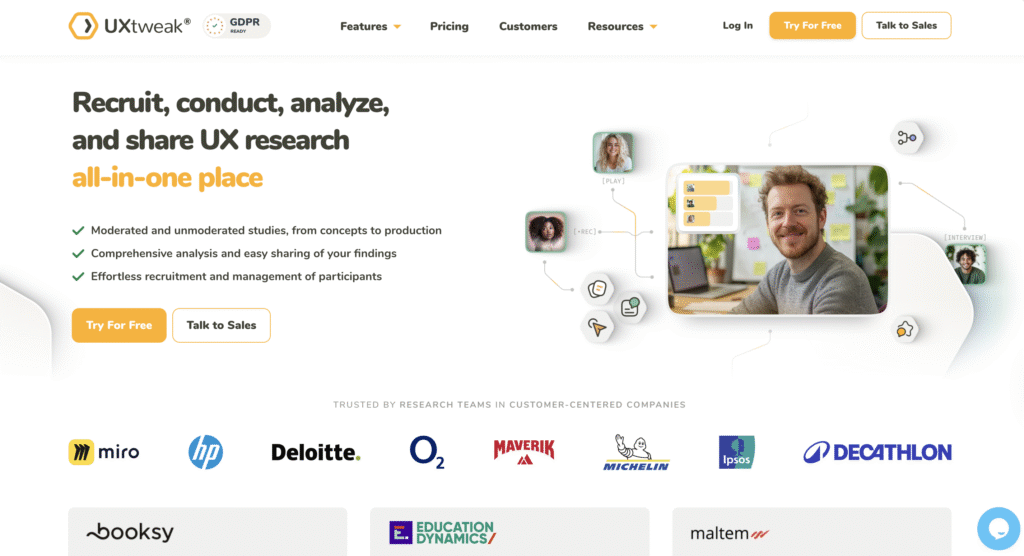
✅ Our top heatmap software, UXtweak, has a 4.7/5 score on Capterra. Apart from tools for website heatmapping, session replay, and advanced analytics, UXtweak also offers solutions for usability testing, user interviews, and other key research methods. Try UXtweak today!
Heatmaps help you analyze user engagement by pinpointing popular areas in your product using color scales. These colors indicate hotspots where users click, scroll, and move their mouse pointers as they interact with your product.
This offers an advanced approach to uncovering hidden insights into user behavior and learning how each user progresses through their user journey.
We have carefully researched top heatmapping tools on the market and chose the best 11 heatmap tools and software to help you improve your product’s UX in 2026.
Before we jump straight to it, here is a table that gives a quick overview of each tool’s reviews from Capterra:
Rating
Ease of Use
Quality of Support
Pricing
UXtweak
5/5
4.8
5.0
✓ Free plan
Plus plan – $107/month Billed annually
Smartlook
4.5/5
4.7
4.5
✓ Free plan
Pro plan starts at $55/month
Hotjar
5/5
4.6
4.5
✓ Free plan
Paid plan – starts from $32.
CrazyEgg
4.5/5
4.5
4.2
✗ No free plan
Paid plan – from $29/month
Fullstory
4.5/5
4.4
4.3
✓ Free plan
Paid plan – from $300/month
Lucky Orange
4.5/5
4.7
4.7
✓ Free plan
Paid plan starts at $18/month
Inspectlet
4/5
4.2
3.5
✓ Free plan
Paid plan starts at $39/month
Mouseflow
4.5/5
4.6
4.6
✓ Free plan
Flat rate starts at $31/year.
Google Analytics
4.5/5
4.1
4.1
✓ Free plan
The tool is free.
Microsoft Clarity
4.5/5
4.6
4.7
✓ Free plan
The tool is free.
Attention Insight
5/5
4.8
4.8
✓ Free plan
Paid plan starts at $23/month.
1. UXtweak
UXtweak is an all-in-one UX research platform with powerful tools for website and mobile heatmapping and session recording. This platform offers robust heatmapping software with scrollmaps, clickmaps, session recording, and in-depth analytics. See what your users click on, what catches their attention and where they get frustrated, all using just one Session Recording tool!
Apart from powerful solutions for heatmapping, UXtweak offers tools for improving the usability of websites and applications, from prototype to production. This heatmap tool also provides features for information architecture research and user behavior analytics beneficial at any stage of the development cycle.
The ratings below are solely based on the tool’s reviews from Capterra:
Overall – 4.9/5
Ease of Use – 4.8/5
Quality of Support – 5/5
Pros
Advanced heatmap analytics that is easy to read – UXtweak offers a variety of heatmap data visualizations that will give you plenty of insights about your users’ behavior.
Onsite Recruiting feature – allows you to turn real website visitors into testers.
Intuitive UI and easy set-up
Has a free plan
Excellent customer service
Offers a handy survey feature for collecting product feedback
Cons
Supports only 10 languages.
Pricing & Plans
UXtweak offers various pricing plans, each designed to suit different testing needs, including a no-cost option for smaller projects.
Free Plan (€0/month) – A great way to experiment with UX research tools at no cost. Includes access to all tools, 15 responses/month, 1 active study, and 14-day access to results.
Business Plan (€92/month, billed annually) – Ideal for teams that require essential UX research tools and features for their projects. Includes 50 responses/month (upgradable), 1 active study (upgradable), unlimited tasks per study, 12-month data retention, reports and video exports.
Custom Plan (Pricing upon request) – Tailored for organizations with advanced research needs, providing unlimited active studies, customizable responses, live interviews, access to a global user panel and much more.
Generate Heatmaps with UXtweak!
The only UX research tool you need to visualize your customers’ frustration and better understand their issues
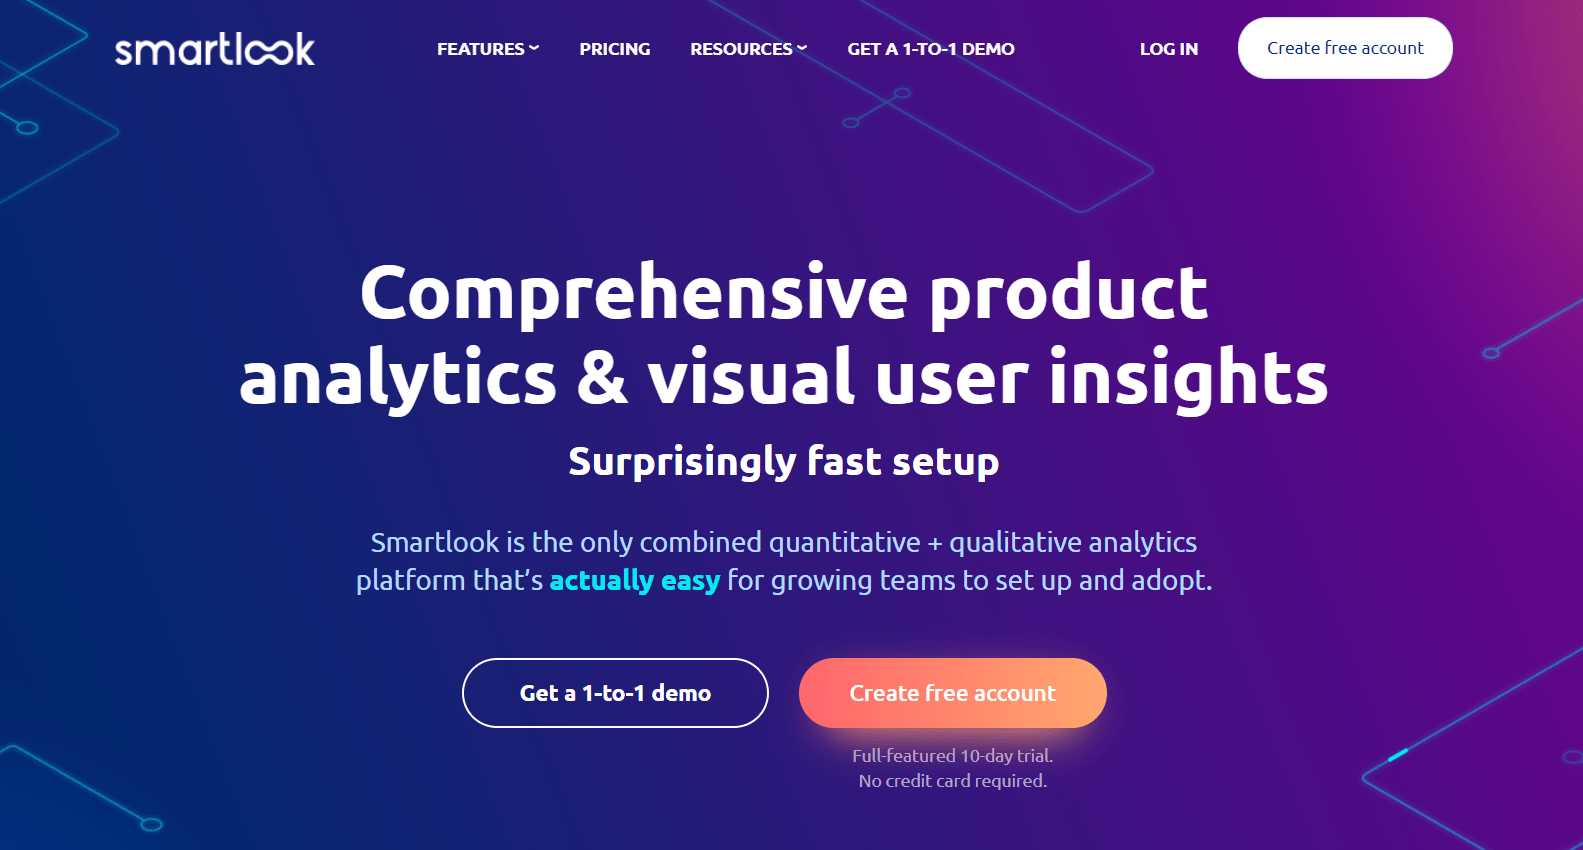
Smartlook is a heatmap software that allows you to capture every user interaction on your website or mobile app and lets you create heatmaps, define events, build funnels, and watch session recordings. It helps you uncover the patterns and trends behind users’ actions. Why do users churn, or why aren’t they using that feature. Smartlook eliminates the guesswork and tells you why users engage and interact the way they do.
Key Features
Session recordings
Heatmaps
Events
Funnels
Crash reports
Cross-platform
Mobile app analytics
Website analytics
User reviews & rating
The ratings below are solely based on the tool’s reviews from Capterra:
Overall – 4.7/5
Ease of Use – 4.7/5
Quality of Support – 4.5/5
Pros
Integrates with third party applications
Has a very simple and intuitive UI
Has a free plan
Has a robust heatmap and analytics functionality
Cons
Data reports and graphic representation can contain errors due to bugs
Inability to create custom tags for users for easier identification
Pricing & Plans
Smartlook helps to capture every user interaction on your website or mobile app and create heatmaps with its free plan. They also have a pro plan that starts at $55/month.
3. Hotjar
Hotjar is a user behavior analytics and heatmap tool that helps businesses to bring their customer data to life with insights. Hotjar gives you an intuitive, visual way to discover, consolidate, and communicate user needs with its heatmap and session recording feature. It helps you to uncover and understand your users’ behavior and create engaging experiences that drive results and improve product UX.
Did you know?…
Users on Reddit generally recommend Hotjar for website heat mapping.
However, some users highlight that using Hotjar slows down website speed.
To avoid this, consider using alternatives, such as UXtweak or Microsoft Clarity.
Key Features
Heatmaps
Session Recordings
Feedback polls
Surveys
User interviews
Integrations
Funnels
User reviews & rating
The ratings below are solely based on the tool’s reviews from Capterra:
Overall – 4.7/5
Ease of Use – 4.6/5
Quality of Support – 4.5/5
Pros
It is very easy to set up and use
Excellent customer service
Integrates with external applications
Very intuitive and simple user interface
Has a versalite heatmap feature that reports in-depth data analytics from user behaviour, engagement, and interaction.
Cons
The user data can oftentimes be difficult to interpret
Slow loading time due to multiple scrolling
Pricing & Plans
Hotjar offers a free plan. The plus plan starts at $39/month.
💡 Pro Tip
Gather visual data and insights about user behavior, interaction, and engagement on your websites and digital products with heatmapping software. In this article, we uncover what heatmap tools are, their types and pricing, as well as their role in improving digital products.
Lucky Orange is heatmap software with dynamic heatmaps and session recording features that give you insight into what people do on your site. It allows you to uncover bottlenecks and other UX challenges and devise improvements using AB tests. Lucky Orange helps you understand why website visitors aren’t converting to grow sales, capture leads, and improve product UX.
Key features
Session Recordings
Dynamic Heatmaps
Surveys
Live Chat
Dashboard Insights
Conversion Funnels
Form Analytics
Visitor Profiles
Announcements
User reviews & rating
The ratings below are solely based on the tool’s reviews from Capterra:
Overall – 4.7/5
Ease of Use – 4.7/5
Quality of Support – 4.7/5
Pros
Daily email updates help to keep the team informed on website traffic.
Has a very intuitive UI and is very easy to set up.
Can have multiple clients under one account without paying for them separately.
Has a dynamic heatmaps and session recordings feature.
Cons
Bots usually give misleading numbers which can alter the result.
Has a learning curve.
With a lot of traffic, the live function does not seem to always work properly.
Pricing & Plans
Lucky Orange offers a free plan. They have a paid plan that offers more advanced features and starts at $18 per month.
5. Crazy Egg
Crazy Egg is a heatmapping software and user behavior analytics tool that helps businesses to analyze visitors’ and users’ behavior across websites and other digital products. This tool enables product teams to investigate buyers’ journeys, identify various audience segments present across the web pages, and recognize issues such as confusing navigation or form glitches. Using the A/B testing tool, design teams can set up specific goals to test web pages.
Key features
Heatmaps
Recordings
A/B Testing
Traffic Analysis
Errors Tracking
Surveys
User reviews & rating
The ratings below are solely based on the tool’s reviews from Capterra:
Overall – 4.5/5
Ease of Use – 4.5/5
Quality of Support – 4.2/5
Pros
Easy to integrate with external applications
Has an excellent heat map and A/B testing functionality
Very easy to set up and understand
Offers great reports with meaningful user data.
Cons
Time-consuming as you spend hours watching session recordings and annotating notes
Pricing & Plans
Crazy Egg doesn’t have a free plan but offers a 30-day free trial. They also have a paid subscription plan that starts at $249/month.
Did you know?…
Due to high pricing of this heatmap software, many users on Reddit recommend using other heatmapping tools. Lucky Orange and Hotjar are the most commonly named alternatives.
6. Inspectlet
Inspectlet is a heatmap software and a user behavior analytics tool that helps businesses observe all the actions users take on their websites. Inspectlet records videos of your visitors as they use your site, allowing you to see everything they do. You are also able to see every mouse movement, scroll, click, and keypress on your site.
Key Features
Session Recording
Dynamic Heatmaps
A/B Testing
Feedback Surveys
Form Analytics
Error Logging
User reviews & rating
The ratings below are solely based on the tool’s reviews from Capterra:
Overall – 4.0/5
Ease of Use – 4.2/5
Quality of Support – 3.5/5
Pros
The session recordings and analytics features are reliable and easy-to-use
Quick and simple to set up
It has a great pricing structure
It has a seamless user experience.
Cons
Customer support is poor
Tags sometimes do not work properly which makes the search filter difficult to use.
Pricing & Plans
Inspectlet offers a free plan. They have a pro plan that starts at $39 per month.
7. Mouseflow
Mouseflow is a heatmap software and user behavior analytics tool used to optimize website experiences towards improving conversions. Mouseflow allows you to watch your website visitors’ sessions, build 6 types of heatmaps for all your pages automatically, set up funnels to monitor drop offs, use form analytics to improve your lead generation, and launch feedback campaigns to learn more about your visitors.
Key Features
Session Replay
Conversion Funnels
User Feedback
Heatmaps
Forms
Friction Score
User reviews & rating
The ratings below are solely based on the tool’s reviews from Capterra:
Overall – 4.7/5
Ease of Use – 4.6/5
Quality of Support – 4.6/5
Pros
Excellent customer support
Very easy to set up and use. There is no learning curve.
Excellent heat map functionality that quickly identifies strengths and weaknesses on any page by analyzing visitor behavior across multiple parameters.
It is user-friendly with a good user experience.
Cons
Prices are a bit expensive
Session replay videos sometimes have trouble loading
Pricing & Plans
Mouseflow offers a free plan. They also have a paid plan that starts at $31 per month.
8. Fullstory
FullStory is a heatmapping software with user behavior analytics features that combines rich product analytics, robust session detail, and collaboration tools to deliver real-time insights that uncover opportunities on web and mobile experiences. With its dynamic heatmaps, fullstory helps businesses to make smarter decisions that eliminate friction and enhance user experience.
Key Features
Frustration signals
User Journey mapping
Dashboards
User segments
Funnels and conversions
Session Replays
Heatmaps.
User reviews & rating
The ratings below are solely based on the tool’s reviews from Capterra:
Overall – 4.6/5
Ease of Use – 4.4/5
Quality of Support – 4.3/5
Pros
It is very easy to use
Offers rich visualizations that provide accurate user data
It is easy to watch sessions recorded on your website or product
Ability to track past visits off their IP, Cookie, etc, and keep a trail
Cons
It is quite expensive
Connection problems when running live session replays
Pricing & Plans
Fullstory offers a free plan. Their paid plan starts at $300/month.
9. Microsoft Clarity
Microsoft Clarity is a free, easy-to-use heatmap and analytics tool that captures how real people actually use your website. Microsoft Clarity instant heatmaps help you to see at a glance which areas on your page drive the most engagement and how far your visitors scroll. It has a session recording feature that gives you a live feed of how people use your site in order to find out what’s working, learn what needs to be fixed, and test out new ideas and insights to help you quickly uncover user frustration and turn these problems into opportunities.
Key features
Heatmaps
Session recordings
Insights
Google Analytics
Clarity for mobile apps
Integrations
Clarity extensions
Co-pilots
User reviews & rating
The ratings below are solely based on the tool’s reviews from Capterra:
Overall – 4.5/5
Ease of Use – 4.6/5
Quality of Support – 4.7/5
Pros
It is absolutely free.
Great tool for small businesses that run e-commerce stores and websites.
It is easy to set up.
Has a heatmap feature that is mobile friendly and reveals clear user data.
Cons
Delays in data processing delay due to limited historical data available. This hinders access to real-time insights, trends, and data.
Pricing & Plans
Microsoft Clarity captures how real people actually use your site for absolutely free.
10. Google Analytics
Google Analytics has a dedicated heatmap Chrome browser extension called Page Analytics (by Google) that shows you where visitors click on your web pages. Its primary function is to provide insights into customer behavior interactions with websites and apps and use your existing Google Analytics data to discover customer trends, and patterns and identify users with high revenue potential while you optimize your product UX for this target group.
Key Features
Automation and analytics
Reporting
Advertising Workspace
Explorations
Data Collection and Management
Advanced-Data Governance
Heatmaps
Session recordings
User reviews & rating
The ratings below are solely based on the tool’s reviews from Capterra:
Overall – 4.7/5
Ease of Use – 4.1/5
Quality of Support – 4.1/5
Pros
Ability to log into multiple accounts at once
It is flexible and adaptable to various industries and business models
Very easy to use
It processes data extremely fast.
Color codes data clusters accurately
Has a dynamic heatmaps feature.
Cons
Troubleshooting takes a while when conducted by self
Pricing & Plans
Google Analytics is a free tool.
11. Attention Insight
Last but not least, we have a heatmap software that offers predictive heatmaps generated by AI that enables you to make user-centric, data-driven decisions about your design, without the labor-heavy process of data collection. Attention insight allows you to validate your design concepts for performance during the design stage with AI-generated attention analytics.
Key features
Design comparison
Attention report
Clarity score
Focus Map and Percentages
Heatmaps
User reviews & rating
The ratings below are solely based on the tool’s reviews from Capterra:
Overall – 4.8/5
Ease of Use – 4.8/5
Quality of Support – 4.8/5
Pros
Has an advanced predictive eye tracking feature
Its user interface has a great visual representation of information
Presents accurate data with its heatmap feature
Great ease of use and efficiency
Cons
Video suggestions are not automatic
Slow in generating reports
Pricing & Plans
Attention Insight helps you to make user-centric, data-driven decisions about your design with its free plan. They also have a paid plan that starts at $23/month.
Best free heatmapping tools
With budget being the primary constraint most UX researchers face, here is a list of cost-effective heatmap tools that you can use for free to kickstart your next research study:
What do heatmapping tools bring for your business?
There is a lot of value that heatmap tools present to a business that helps them stay ahead of the curve and remain user-centric. Some of these benefits are:
1. User Behavior Analysis
Heatmaps identify and visualize user behavior by showing where they click, scroll, or hover the most. This helps your product teams understand what design elements and content are popular and interesting to users. You can then spot popular web pages, improve user flow and navigation, and optimize web or UI layout for a better user experience.
2. Conversion Rate Optimization
Heatmaps reveal which parts of your website or app are most effective in converting visitors into customers. By analyzing click patterns, tracking trends and identifying areas with low engagement, you can make data-driven decisions to optimize your conversion funnels and increase conversion rates.
3. Page Optimization
Heatmaps help you identify specific sections on the webpage that confuses users. By spotting design elements and content that receive fewer clicks or attention, you can make targeted improvements, such as adjusting font or typography for legibility, changing button placements, or optimizing forms.
4. Mobile Optimization
Heatmaps are essential for mobile optimization. They show how users interact with your application or website on different screen sizes, enabling you to optimize for smaller devices. Design elements and content can therefore be optimized by resizing and repositioning elements to fit smaller screen resolutions.
5. A/B Testing Insights
With heatmaps you can compare click patterns, scroll depths, and engagement levels to find out which version of a page or feature users engage better with.
Heatmaps provide actionable data that helps you make informed decisions about website or app improvements. With this data, you can enhance user experience, increase conversions, and drive business growth.
How to choose the right heatmapping software?
There are several factors to consider when choosing the right heatmapping software. You want to choose the heatmap tool that has the right features and functionality tailored to understanding your users’ needs. Here are a few things to consider when making your choice:
Features: Choose the heatmap tool that offers a range of useful features such as click heatmaps, scroll heatmaps, eye-tracking heatmaps, and user session recordings which will help to provide insights into different aspects of user behavior.
Ease of use: Go for the heatmap tool that is user-friendly and doesn’t require a long and complicated onboarding process. This frees up more time for you to focus on analyzing user data and getting the best result.
Integrations: Identify the heatmap tool that integrates smoothly with your existing website analytics tools. With seamless integration, you can streamline your workflow and make the analysis more efficient.
Pricing: Consider your budget and choose the heatmap tool that fits within your range. Some heatmapping tools offer free plans with limited features which have been listed above.
Which heatmapping software caught your eye?
Heatmapping software and tools are primarily useful in visually representing user behavior and data in a way that highlights patterns, trends, or concentrations of user engagement and interactions. The insights collected from heatmaps in combination with session replay tools help to make data-driven decisions that enhance user experience, increase conversions, and drive business growth.
UXtweak has a robust heatmapping tool, with scrollmaps, clickmaps session recording and in-depth analytics that businesses can use to analyze the user experience their users have while using their digital products.
Can you do a heat map in Excel?
Yes. You can create a heatmap bin Microsoft Excel by manually color coding each cell depending on its value and enter a formula/function to any numerical work.
Does Google Analytics have a heat map?
Yes. Google Analytics has a dedicated heatmap Chrome browser extension called Page Analytics (by Google) that shows you where visitors click on your web pages.
How do I make a heatmap for free?
You can make a heatmap for free by using UXtweak’s robust heatmapping tool, with scrollmaps, clickmaps session recording and in-depth analytics.
Hive full of creative minds, UX researchers, UX/UI designers, content writers and editors dedicated to sharing their collective knowledge and expertise with the UX community.
Our content team collaborates to produce high-quality resources on a variety of topics related to UX research, UX/UI design, usability and user testing, and a lot of actionable UX tips. See full bio
Share on socials|
Learn why these premium brands trust UXtweak
UXtweak is buzzing with expert UX research, making thousands of products more
user friendly every day
This article covers User Interviews' pricing plans, compares them with alternatives like UXtweak’s User Panel, and helps researchers choose the best tool for their needs. Read more ...
Unlock the full potential of your research with Atomic UX Research, a framework that breaks down knowledge into actionable insights, enhances collaboration, and ensures your findings are clear, scalable, and reusable. Read more ...
If you are looking for the best Validately alternatives, which will not break your budget, you've come to the right place. We've put together a list of 10 Best Validately alternatives that will make your hunt for a new tool a lot easier. Read more ...