
User-centered design is a top priority for forward-thinking companies. They rely on data-driven user insights, analytics, and research to improve their products. To automate this process, there are various software and tools available.
In this article, we’ve compiled a list of the best product analytics and research tools.
What are product analytics and research tools?

Product analytics tools help track user engagement and interaction, inform the product team, and provide insight into product performance and errors. Product analytics tools visualize and analyze user data to identify where users spend most of their time and drop-offs.
Product teams use this data to improve their product. Users often start with standard platforms before moving to custom analysis, requiring additional training to improve Excel skills.
Product research tools help product teams understand user needs by collecting unbiased data through research methods such as card sorting, tree testing, qualitative research, and surveys. They also enable organizing their research process effectively, leading to ultimate product success.
This data is then used to develop actionable steps for product development, leading to increased efficiency and speed in delivering products that customers will value.

Top 10 product analytics and product research software
UXtweak
UXtweak is a product research tool that helps you to gather meaningful data about your digital product and understand your users. It perfectly visualizes customer frustration to better understand their issues in the form of pixel-perfect session replays, heatmaps and many other powerful analytics tools.
Track user’s clicks, scrolls, mouse moves and discover new ways to improve your product website. Its goal is to help you save time by using its automated research methods, which would utilize state-of-the-art ML and NN technologies.
Tools:
- Website Testing
- Card Sorting
- Tree Testing
- Session Recording
- Heat Maps
- Prototype Testing
- Mobile Testing
- Preference Testing
- Five Second Test
- Surveys
- First click testing
Unique tools also include the Onsite Recruiting, a built-in reward feature to motivate respondents to participate in your research. Alternatively, you can recruit participants from the 155M+ User Panel.
Not only that, there is also Think-aloud protocol to collect audio feedback using respondents’ microphones, and Crowd Feedback, which allows users to submit and vote for other people’s ideas to improve the website. Product teams can use UXtweak in every stage of the product research journey.
Pros
- Easy to use even for a complete beginner
- Unlimited studies – with UXtweak you can test as much as you want
- Free plan for smaller projects or you can customize a plan to fit your demands
- It offers advanced analytics that are easy to read
Cons
- Supports only 10 languages
Pricing:
UXtweak has designed a variety of pricing plans to suit different user testing requirements:
- Free Plan (€0/month) – Forever free, a great way to experiment with UX research tools at no cost. Includes access to all tools, 15 responses/month, 1 active study, and 14-day access to results.
- Business Plan (€92/month, billed annually) – Ideal for teams that require essential UX research tools and features for their projects. Includes 50 responses/month (upgradable), 1 active study (upgradable), unlimited tasks per study, 12-month data retention, reports and video exports.
- Custom Plan (Pricing upon request) – Tailored for organizations with advanced research needs, providing unlimited active studies, customizable responses, live interviews, access to a global user panel and much more.
For more information on the features of each plan, visit the UXtweak pricing page. 🐝
Quantum metric
Quantum metric is a machine learning product analytics tool that helps you automate the identification of technical issues and confusing user experiences in real time. You can empathize with your customer and easily resolve issues with detailed session replay coupled with UX analysis that is easy to use and draw insights from.
Quantum metrics is known for automatically identifying user experience issues.
Tools:
- Sessions – Digital Analytics
- Standard Event Tracking
- Funnels
- Custom Event Tracking
- Engagement
- Entry and Exit Pages
- Conversions
- Real-Time Reporting
- Custom Reports and Dashboards
- Click Tracking
- Mouse Movement
- Frustration Tracking
- Data Analysis
- User Identification
- Search Box
Pros:
- This product tool integrates with major platforms such as Salesforce, Google Cloud, Slack, and Google Analytics.
- Quantum makes optimizing your customer experience so much more efficient.
- Quantum has great customer service.
- Excellent in helping to quantify your product.
Con’s:
- Not entirely easy to configure on your own
- Little or no documentation to explain some technical functionalities.
Pricing:
Quantum Metric costs from $5,500/user/month. There is no free trial.
UXCam
UXCam is a user experience analytics tool for mobile apps that offers session replays, heatmaps, funnel analytics, and event analytics in order to help you or your product team understand the how and why behind your customer journey. UXCam automatically captures, processes, analyzes, and visualizes user behavior data.
UXCam is a great tool for helping SaaS companies identify usability problems in mobile apps, track performance metrics, and make informed design choices.
Tools:
- Performance and Reliability
- Exit Tracking
- Retention
- Return
- Conversions
- Demographics
- User Segmentation
- Geolocation
- Real-Time Insights
- User Path Tracking
- User Activity History
Pros:
- UXCam offers an ideal way to review mobile App’s session recordings.
- Helps you understand user behavioral data.
- UXCam integrates with major platforms including Firebase, Google Analytics, and Segment.
Cons:
- The filtering of users to exclude internal testers feature is not intuitive enough.
- It can sometimes be difficult to create custom events since it needs to be done on the backend with engineering.
Pricing:
UXCam offers a free plan that includes 10,000 sessions/month, and a free trial with 100,000 sessions/month.
💡Curious about the pricing and value of UXCam? Check out our article on UXCam pricing!
Mixpanel
Mixpanel is an event-based analytics software for web and mobile that provides interactive reports which helps to analyze user behavior cost-effectively. This software helps product teams measure what matters, make decisions fast, and build better products through data.
This tool takes a different approach than most analytics platforms. Instead of analyzing by page views, it measures the actions or steps taken by users and visitors visiting or using the product application while being monitored.
Tools:
- Interactive reports.
- Team boards and Alerts
- Limitless segmentation
- Group Analytics
- Data integration and Management
Pro’s:
- Track and analyze user behavior on websites and mobile applications.
- Very intuitive user interface.
- Easy to use and quick to get started.
- Mixpanel integrates with platforms such as Google Cloud, Optimizely, Zoho, and Slack
Con’s:
- Some statistical data are not available
- Does not send surveys to customers directly in-app
- It is time-consuming to set up Mixpanel
Pricing:
Mixpanel starts at $20/month/account. A free plan is available for up to 100,000 tracked users.
Heap
Heap provides you with digital insights that helps you completely understand your customers’ digital journeys, so you can quickly improve conversion, retention, and customer delight. It captures every user action taken on a website like which pages people were on, what element they clicked on, the color of the button, the target text on the click, the actions users took before and after clicking.
Heap helps you to improve user experience by pinpointing exactly where users are struggling and quickly make improvements to the customer experience, ensuring an intuitive, enjoyable experience.
Tools:
- Session Replay
- Heap Illuminate
- Journeys
- Segments
- Dashboards
- Charts
- Playbooks
- Capture
- Enrichment
- Integrations
Pro’s:
- Heap integrates with platforms such as Shopify, Salesforce, and HubSpot
- It is simple to use
- It has a broad scope of functionalities
- Very effective data visualization feature
Con’s:
- Accumulates a lot of cache files which slows down the software
- It is not intuitive enough.
- It does not read custom events API that are not structured correctly.
Pricing:
Heap is free to use for 1 project and up to 10k sessions/month. Paid plans are offered with customized pricing upon request.
Hotjar
Hotjar is a product research tool that provides product experience insights that show how users behave and what they feel strongly about, so that product teams can deliver real value to them and get feedback.
Hotjar is a great way to collect continual feedback throughout your entire product development process.

Tools:
- Integrations
- Funnels
- Dashboard
- Highlights
- Trends
- Heatmaps
- Click Tracking and mouse movement – Session recordings
- Surveys
- Error and Bug Tracking
Pro’s:
- Easy installation process.
- Very intuitive user interface
- Heatmaps makes it easy to track your website’s UX
Con’s:
- The software is expensive
- Analysis of the conversion funnel and forms are not very detailed.
Pricing:
Hotjar has 12 pricing editions, with their basic offer starting at 32 Euros for 100 daily sessions. Hotjar also has a free trial version.
Smartlook
Smartlook helps you to start collecting every user interaction with your product with one snippet by auto collecting all user data and preparing this data for analysis. This software offers customers the opportunity to get answers to their questions weeks or even months easier and faster.
Smartlook’s feature immediately analyzes the data as soon as an event is defined which saves them from having a delay of several weeks between detecting an anomaly and being able to investigate it as opposed to having unattended open customer tickets.
Tools:
- Session recordings
- Heatmaps
- Events
- Funnels
- Crash reports
- Cross-platform
- Mobile app analytics
Pro’s:
- User-friendly interface makes it easy to navigate and understand user data
- It is very beginner friendly
- Implementation is simple and does not require technical knowhow with tracking events and gathering contextual information.
Con’s:
- Heatmap feature is not efficient
- Privacy of user data collected by Smartlook is sometimes not secure.
Pricing:
Smartlook has a free trial of 3000 sessions per month.
Pendo
Pendo helps product teams ask and answer questions like: What features are customers or employees interacting with? Which are they ignoring? What parts of the product are driving delight or frustration? Through targeted walkthroughs and messaging within the app help you improve onboarding and feature adoption.
This tool also allows product teams to capture, prioritize, and manage customer feature requests using Pendo Feedback. This provides a pipeline of product insights from sources such as user interviews, beta testing, reviews, and customer success check-ins. The output data is therefore combined with relevant analytics to improve product roadmap.
Tools:
- Analytics
- Mobile
- In-app Guides
- SaaS Portfolio Insights
- Feedback
- Integrations
- Roadmaps
- Services & support
Pro’s:
- Pendo integrates with third-party solutions such as Algolia, Figma, HubSpot, Jira, Microsoft Teams, Slack, Salesforce, and Tableau.
- Easy to use solution that helps to analyze and improve user experience
- Very intuitive user interface.
Con’s:
- Little or no support
- Dashboard limitations
Pricing:
Pendo offers customized pricing upon request. It also has a free plan that supports up to 1,000 active users.
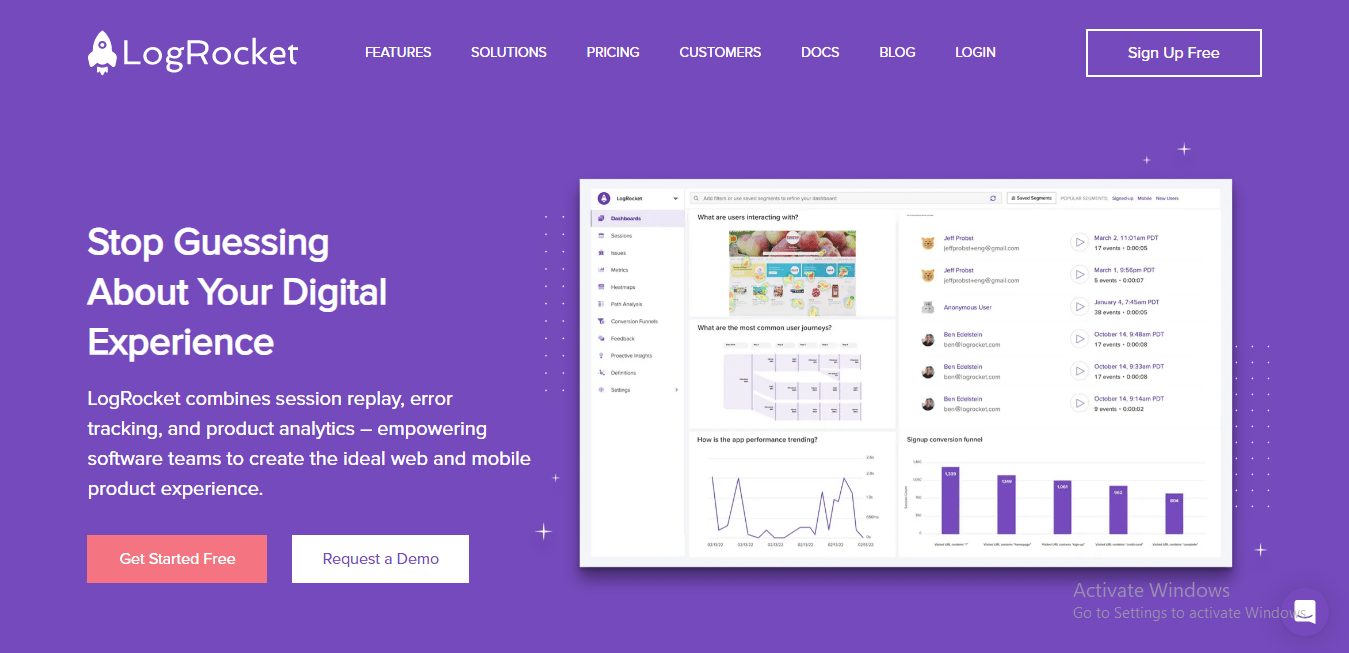
LogRocket
LogRocket is one of the best softwares out for session replays and performance monitoring. LogRocket helps development teams to fix software problems, improve conversions and maximize product engagement. It has a great combination of session replay, product analytics data, and performance monitoring in one platform.
By watching real users interact with the app, Logrocket uses ‘rockets’ to help analyze the performance of Javascript-based apps in order to help product teams make better informed product decisions.
Tools:
- Session Replay for Developers
- Error Tracking & Issue Management
- Frontend Performance Monitoring
- Session Replay for Product, Design & Marketing
- Product Analytics
- UX Analytics
- Frustration Issues
Pro’s:
- LogRocket integrates with popular software development tools such as GitHub, Jira, Trello, Sentry, and Mixpanel.
- Versatile software that allows you observe user sessions for any particular flow you’re optimizing for.
- Offers amazing customer support
- Great debugging for your development team.
Con’s:
- Link sessions are unavailable
- They do not integrate with core communication tools like Slack.
Pricing:
LogRocket starts at $99/user/month. There is a free plan which allows for up to 1000 sessions per month.
Zoho Analytics
Zoho Analytics provides features that can help you with slicing and dicing data as required using a variety of charts, widgets, pivot tables, and tabular view components to best tell your product story. Zoho Analytics connects, prepares, and analyzes your product data on a large scale whereby the data that is prepared is handled directly in the Zoho application.
With its extensive data integration, Zoho Analytics makes it easy to see which products are performing best.
Tools:
- Data Integration
- Data Preparation
- Visual Analysis
- Augmented Analytics
- Unified Business Insights
- Collaborative Analytics
- Data Storytelling
- Mobility
- Embedded BI
- Security & Governance
- Deployments
- Extensibility & Elasticity
Pro’s:
- Zoho Analytics integrates with major platforms such as Salesforce, Microsoft Dynamics, and HubSpot.
- Very intuitive UI
- Supports data collaboration to curate a strong story
- Features a smart AI assistance that generates insights.
Con’s:
- May require technical support to set up
- Data might often need to be interpreted by data scientists and analysts.
Pricing:
Zoho Analytics’ pricing starts at $24/user/month. They also offer a free plan for up to two users, as well as a 15-day free trial.
Product analytics and UX research tools play a major role in the success of the everyday digital products that we use.
Why use product analytics tools?
Using product analytics and research tools helps teams to:
- Track user interactions within a digital product such as number of visits
- Conduct qualitative and quantitative product research to understand user needs
- Identify pain points within a product that may lead to drop-offs or churn
- Organize processes for efficiency and speed
- Use data-backed customer insights to guide product decisions
- Get validation and stakeholder buy-in for product feature ideas and decisions
- Identify behavioral patterns and flows through the product
When you use the right product analytics and research tool to improve your product development process, you get faster output and a more reliable result that helps you put users and customers at the center of your product decisions.
To further elevate the the performance of your product development process you can use a well-known open-source database like PostgreSQL, where the data can be easily migrated from other databases – like MySQL data to PostgreSQL, for example.
Database administrators can monitor PostgreSQL performance and analyze information to optimize performance by taking into account hardware capacity, table partitioning, index usage, configuration parameters, etc.
The key features of product analytics and research tools
The key features of product analytics and research tools includes; event tracking, session recording, funnel analysis, and heatmaps.
- Event tracking – This feature in product analytics tools helps to track user interactions throughout the product by showing trends that help to identify how and why the user is engaging with the product. For example: You want to track an event on the “product offering” section of your website on a particular device (desktop or mobile). This feature gives an analysis on interactions, such as how many users clicked a particular button and even more detailed analysis that most times may need to be synthesized and interpreted by data analysts and scientists.
- Session recording – They automatically collect all user interactions with your product website and give you the ability to either watch individual user sessions and activities to understand specific user behaviors, like where users click, how much time they spend on a page, and what issues they face along the way. For example, this feature helps you learn how your users act when navigating a particular design feature within their customer journey by recording each action they take during the interaction. This is a great way to gather qualitative feedback on your product.
- Funnel analysis – The funnel analysis feature is made up of any two or more events that helps you spot the number of users who completed a particular action (an event) and went on to also complete another one (a different event). It aggregates the conversion rate between each action or step completed by the user and creates a visualization for you that highlights the step or action with the highest drop-off.
- Heat maps – The heat map features provides an aggregated view of how users interact with a website or product, and helps you spot which elements make users click or bounce off through color-coded graphic representations.
- User Segmentation – This feature helps to identify who users are, where they came from, and what they are interested in.
- A/B Testing – This feature helps to compare different versions of features, design options etc. to see what works best.
These features work together to help make product and research tools and software efficient and reliable enough in handling sensitive customer data and providing real unbiased insights.
Another great feature that many product analytics tools provide are integrations. Using an integrated platform allows you not only to analyse the research data, but also effectively share the analytics results among team members and company departments, as well as use it for various non-research related purposes. Several of the platforms we mention here offer great cross-platform connectivity, for example – Hubspot integration, which is definitely a great advantage.
10 free product analytics tools
For small and early product teams, you can leverage some of the tools that are free and begin to automate your product development process early on.
Here are 10 free product analytics tools for those on a budget:
All product and research software listed have free trials and versions which can help you hit the ground running with creating a watertight research process and healthy product roadmap.
Use analytics to improve product experience
To build a successful product, you must strive to ensure that it comprises core features that meet users’ needs and wants, presented in the most intuitive and clear way.
Product analytics and research tools help product teams stay ahead of the curve, meet all user requirements, and gain a competitive advantage with a solid product map that ultimately improves product and user experience.
Use UXtweak’s session recordings to collect data on how users react to your product and pinpoint issues they’re facing as they interact with each page and feature. You can then use this data to prioritize product iterations or introduce new features to meet user needs.
After you’ve made changes, leverage surveys and feedback to get first-hand product experience feedback from your users and spot opportunities for gauging future product decisions.
Register for your free account today and try UXtweak for product analytics!