Key Takeaways
📊 UX metrics help track and improve user experience by focusing on key aspects like usability, satisfaction, and performance.
🔄 UX measurement is an iterative process—track, refine, and retest to make consistent improvements.
🚀 UX tools like UXtweak offer detailed feedback, usability testing, and advanced analysis for improvement.
Why you should measure UX effectiveness
When it comes to measuring UX, you’ve got to do it right. There are plenty of metrics out there, but picking the right ones depends on your goals and the methods you’re using. The metrics you choose will directly impact the results you’re looking for – whether that’s improving how easy your product is to use, understanding how users feel, or figuring out what’s working and what’s not.
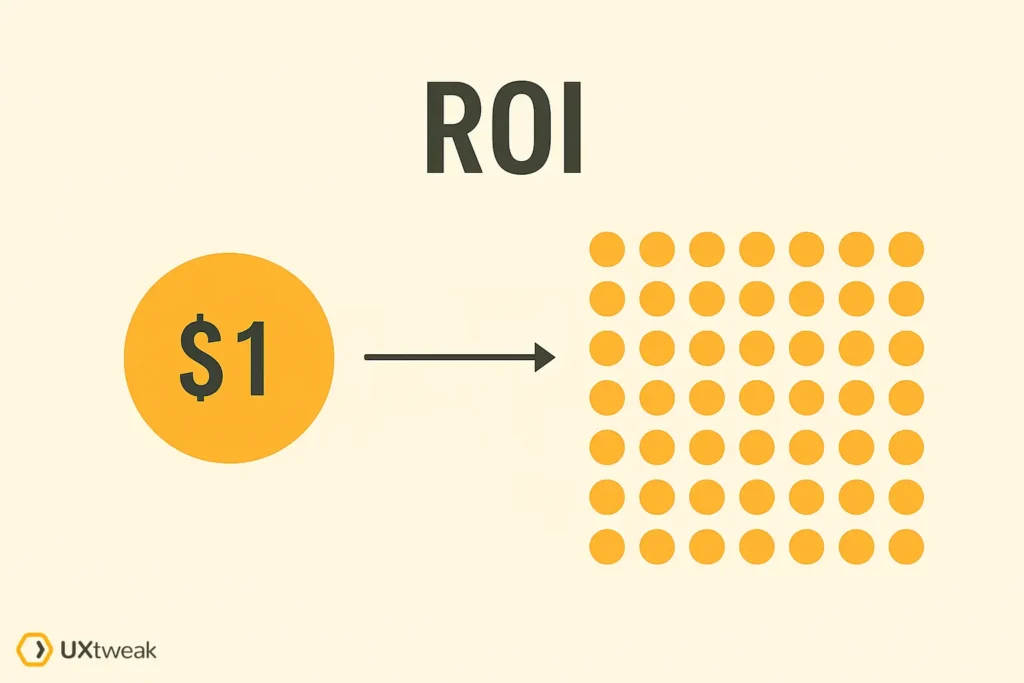
But why bother measuring UX? It’s simple: to improve it. Forrester’s research shows that every $1 invested in UX results in a return of $100.
Book tip
If you’d like to learn more about this topic, check out the book by Tom Tullis, where he explores methods for quantifying user experience. Measuring the User Experience offers practical tools for assessing UX effectiveness. The third edition, released in 2022, expands on new research and advancements in measuring emotional and physiological responses, such as eye-tracking and emotion analysis.
How to Measure User Experience
When it comes to measuring UX, it can be overwhelming to know where to start. With so many metrics available, it’s easy to feel lost in the data. The key is to focus on what’s most important for your specific goals.
Here’s how to get started:
1. Focus on the right metrics
Start by asking yourself what you’re trying to achieve. Are you improving task completion rates? Or maybe you’re optimizing user satisfaction? Define your goals first, and then choose the metrics that align with them. For instance, if you’re aiming to reduce user errors, you might focus on success rate and error rates. If engagement is your goal, look at metrics like time spent on a task or repeat usage.
A great method for staying on track is the SMART framework (Specific, Measurable, Achievable, Relevant, Time-bound). It helps you keep your goals clear and ensures your metrics match the business objectives you’re working toward.
2. Choose your tools wisely
Now that you’ve identified your key metrics, it’s time to select the tools that can help you track them effectively. Some popular options include:
UXtweak (ideal for usability testing, gathering detailed feedback, and advanced analysis)
This platform makes it easy to combine usability testing with user feedback in one place. It provides metrics like task success rate, user satisfaction, and time on task – all of which can help you identify where users struggle and how you can improve the experience.

Google Analytics (best for tracking user behavior and discovering trends)
For tracking how users interact with your website or app, Google Analytics is a great option. It helps you understand behavior trends, such as which pages get the most traffic or where users tend to drop off.

3. Analyze and optimize
Once you collect user data, analyze it to identify strong and weak engagement areas. Use these insights to improve your UX strategies and address any issues. Measuring UX effectiveness shows if your changes are working. For example, tracking success rates helps you see if users are achieving goals more easily after adjustments.
Metrics also help communicate progress to stakeholders, justifying UX investments. They guide where to focus your efforts – if users struggle with a task, it signals a need for improvement. Continuously comparing metrics ensures you’re making informed, data-backed improvements.
4. Iterate
There’s no way of determining UX effectiveness without going through the cycle repeatedly and retesting. If your success rate was 70%, that’s good to know, but you should be aiming to improve it.
Iteration is important so that you can compare metrics and thereby determine your UX effectiveness, and there’s also the fact that you’ll likely never solve 100% of the problems your users face with just one or two design cycles.
NNG says it’s better to run three rounds of usability tests with five participants rather than one big study with 15 participants. With the former, you are identifying the majority of issues and actively making changes. According to Nielsen Norman Group, conducting a usability study with five participants “lets you find almost as many usability problems as you’d find using many more test participants.” This statistic is to help you avoid diminishing returns (spending too much time and money running tests to the point where you don’t learn or identify enough new issues).
Learn more about how many participants you need for a UX research study.

UX Metrics Categories and Examples
To simplify the process of measuring UX, we’ll divide it into three clear categories: behavioral metrics, attitudinal metrics, and performance metrics. These categories address different aspects of the user experience, allowing you to focus on key areas for improvement and get actionable insights.
1. Behavioral Metrics
Behavioral metrics are about understanding what users actually do within your product. These metrics focus on tracking user actions and interactions, helping you uncover where they encounter obstacles or find success.
Error rate
Each task you create for a usability study has an ideal path from start to finish, or at least a path that your design team believes to be the best path. During your testing, your participants will make errors, like clicking the wrong button, not noticing a call to action, or anything else outside your intended path.
To determine your error rate, divide the total number of errors by the number of attempts. This is the calculation for tracking multiple errors across your study.
There is another calculation for if you are tracking a specific error and want to measure the error rate; you would divide the total amount of times that specific error occurred by the total number of opportunities for that error. Of course, either way, you want your error rate to be as low as possible.
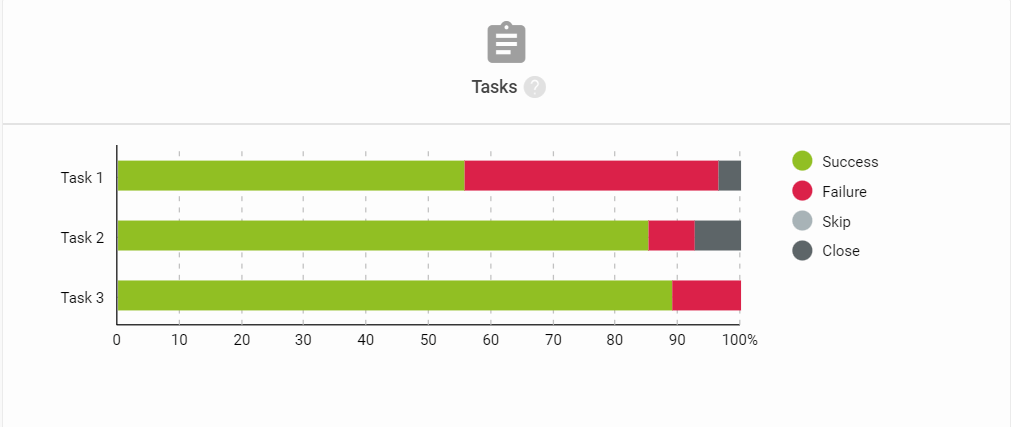
The biggest benefit of online usability testing tools is that they calculate all this information automatically, allowing you to save some time on the analysis and focus on the results.
Here’s the example from the same demo study. These statistics are automatically generated in UXtweak for each completed study. Here you can see both the success and error rate for all tasks of the study. They are color coded for easy comprehension.
Time on task
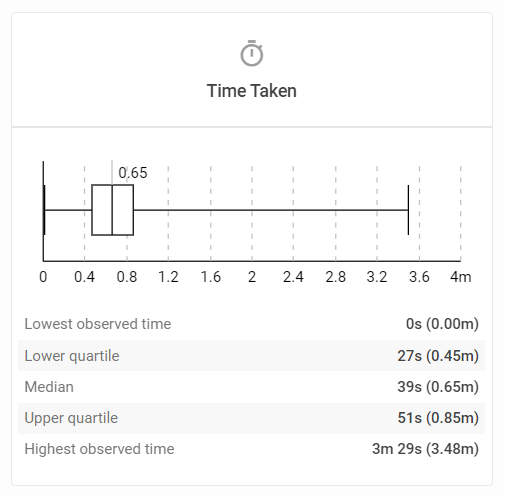
Tracking the amount of time your participants spend on a task in a usability test is a good way of determining potential areas of confusion. If there’s a page on your website that the majority of your participants spent longer than necessary, then perhaps there’s a reason for it. Did they make any errors while on the page? Did they have any questions or voice any concerns?
For example, if one of your tasks is to log into an app, this task should take a few seconds. But you notice some of your participants taking too long on the page. Are they having trouble with the text fields? Are the login instructions unclear? Is the login button obvious enough?
There are several reasons why a task may take longer than expected and these might be exactly the usability flaws that need to be eliminated. The general goal is to have tasks completed quickly and successfully.
Among the other metrics inside UXtweak app, each task has a time on task statistics which looks like this:
2. Attitudinal Metrics
Attitudinal metrics explore how users feel about their experience with your product. These metrics dive into user satisfaction, perceptions, and emotional responses, giving you a sense of how well your product meets their needs.
System Usability Scale
John Brooke created the System Usability Scale (SUS) in 1986. It’s a questionnaire that you have your participants complete at the end of the usability test, right after they complete/attempt all the tasks.
The SUS consists of 10 questions that help determine a user’s opinion about the usability of a website or mobile app (SUS applies to other types of interfaces outside of websites and apps, but is most commonly used for these digital products in UX).
The average SUS score is 68. Any scores lower imply there is a lot of work to do and likely several design changes that will improve the overall UX. The idea is that you should constantly aim to improve your SUS score.
Learn more about the System Usability Scale.
To create your SUS questionnaire, simply ask your user the 10 questions or use a survey tool. Then plug the answers into a SUS calculator, like this one.
Adoption rate
The adoption rate is the quantity of new users divided by your total users for a specific timeframe. For example, if you have 10 new users in a month and 100 total users, then your adoption rate for the month is 10%.
How does this relate to UX effectiveness?
Ideally, if you improve the UX, your adoption rate should improve, which leads to your total user count increasing. In theory, more users equals more revenue (or a higher valuation). But, it’s important to note that factors outside of your UX efforts impact adoption rate. For example, marketing campaigns have the power to significantly impact an adoption rate.
Retention rate
The retention rate is the percentage of users who continue using your website or app over a specific timeframe. To calculate the retention rate, you divide the number of users at the end of the timeframe by the number users at the beginning of the timeframe.
Like an adoption rate, many factors influence a retention rate, but the retention rate “usually correlates with the quality of the UX,” according to UXcam.

3. Performance Metrics
Performance metrics evaluate how well users can achieve their goals with your product. These metrics focus on measuring efficiency and success, ensuring that users can complete tasks with ease and without frustration.
Success rate
According to David Travis and Philip Hodgson, authors of Think Like a UX Researcher, “Success rate is the most important usability measure with any website.”
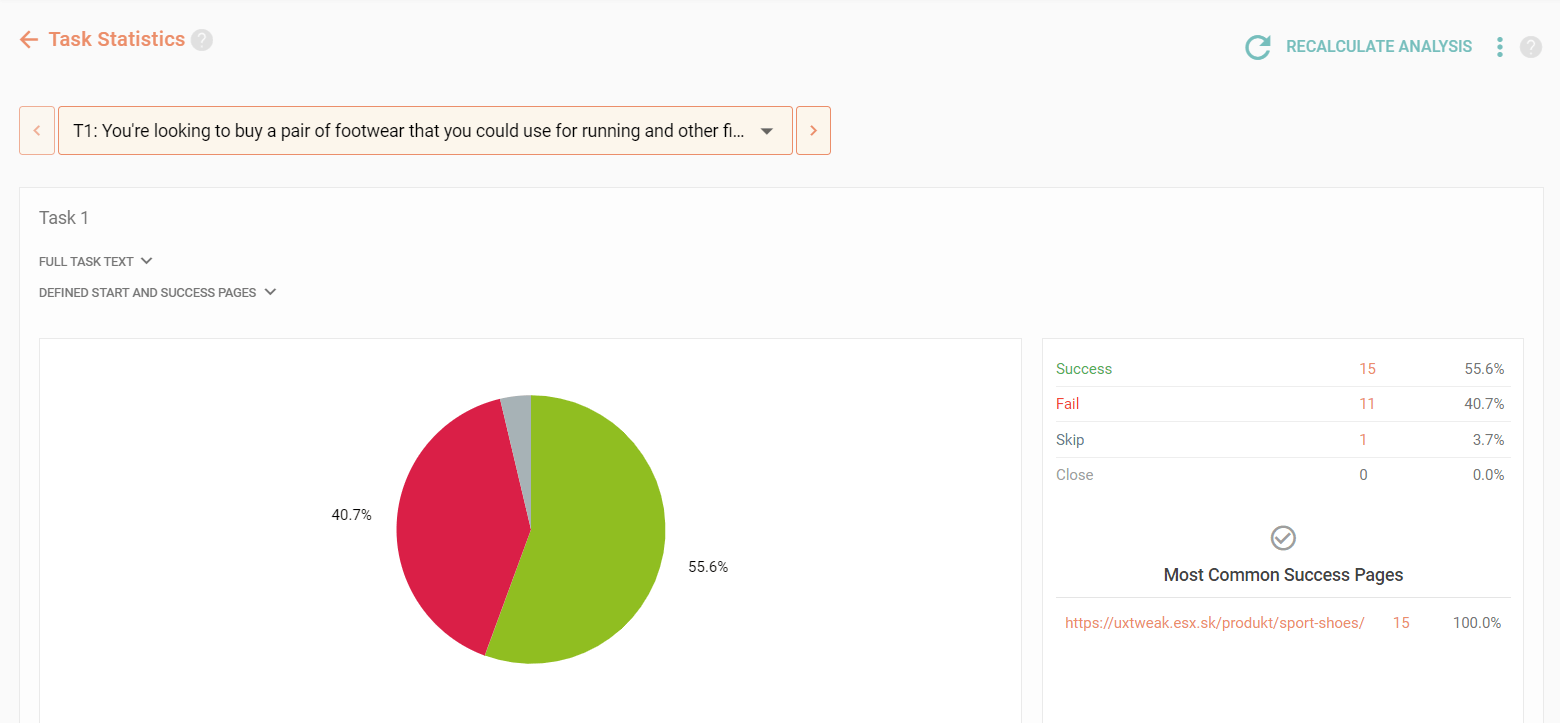
In a usability study, you ask your participants to complete tasks. The tasks you create have a specific goal, a place on your website or mobile app where you want your user to end up. Your success rate is simply how many of your participants successfully completed the tasks versus those who didn’t. So if six out of 10 participants were successful, then your success rate is 60%.
A study by Jeff Sauro from 2011 found that 78% is an average success rate, so that’s a good place to start. If you’re below 78%, there’s a lot of room for improvement.
Here’s an example of the success rate statistics on our demo usability testing study. In this task participants were asked to choose and buy running shoes from an online store:
View the full sample results report.
Efficiency
Efficiency measures how quickly and successfully users can complete a task. For example, in an e-commerce site, it could track how fast and smoothly a user can find a pair of shoes by navigating through the categories. If the process takes too long, it might indicate that the navigation is confusing, filters are ineffective, or important information is hard to find.
The efficiency can be calculated by dividing the task success rate by the average time spent on the task.
More UX Metrics Through Practical Examples
The UX metrics listed above are just a handful of the ways you can measure UX effectiveness. We prepared several study examples, which include the types of reports and metrics generated with UXtweak’s tools.
The metrics for something like a card sort are likely different from the metrics you measure for a usability test, but there will also be similarities. For example, you may measure time on task for both types of studies, but only the usability test would require you to measure the task success rate (because there is no task success rate with a card sort).
Interested specifically in usability metrics?
Read our guide or watch the video below.
Conclusion
If you are constantly seeing improvement in your metrics then your UX effectiveness is high, and that’s exactly what you want. You want your success rate increasing and your time on task decreasing. Identify where your users are making errors, improve your SUS scores, and help grow your user base as much as possible.
Some stakeholders will ask you about their return on investment (ROI) when it comes to UX efforts, and they typically want to see hard numbers. So even if you’re conducting qualitative research, there’s always a way to communicate the UX effectiveness in a way that quantifies the improvements.
Register for your free account at UXtweak and let us help you make research easy!