 Deutsch
  English
  Español
  Français
Key takeaways
👉 System Usability Scale, or SUS, is a standardized post-usability test questionnaire.
❗ SUS is comprised of 10 Likert-scale questions.
⚖️ To collect the SUS score, you have participants rate how strongly they agree or disagree with statements on a 1-5 scale
✔️ SUS helps measure the perceived ease of use for any systems, from physical to digital products (software, websites, apps, etc.)
❌ SUS is not a diagnostic; it does not identify the specific factors that make a system usable or unusable
💡 While scoring is a bit complicated, its consistency, simplicity, and commonality in the industry make it a worthwhile choice to leverage
In this article, we’ll provide a practical guide on the system usability scale. We will go over its purpose, how to calculate the SUS scores, and interpret the results.
With a brief overview of its origins, we will also analyze what is considered a good SUS score and what the future holds for this popular usability testing metric.
What is a System Usability Scale (SUS)?
The system usability scale (SUS) is a standardized questionnaire (survey) used to measure the perceived usability of a system (product). It provides a score from 0 to 100, where higher scores indicate better usability.
The SUS questionnaire consists of 10 questions (statements) which respondents answer using a 5-point Likert scale. Their answers indicate their level of agreement or disagreement with the statements ( 1 = strongly disagree, to 5 = strongly agree).
If you take a close look at the SUS questions above, you will notice that the statements alternate – odd-numbered ones are positive, and even-numbered ones are negative.
This is to prevent respondents from choosing the same answer for all questions and to counteract the acquiescence bias – a natural tendency of people to agree with statements rather than disagree.
💡 Pro Tip
The SUS survey is designed and should be utilized as a post-test questionnaire, meaning you should give the questionnaire to users after the user test.

Origins of the system usability scale (SUS)
The System Usability Scale (SUS) was developed by John Brooke in 1984 to provide a tool for measuring the usability of various systems. Brooke created SUS while working at Digital Equipment Corporation to address the need for a simple yet reliable method to evaluate system usability across different industries.
Over the years, SUS has gained global adoption due to its ease of use, reliability, and validity – in fact, the original paper has over 20,000 citations.
Nowadays, it’s one of the most well-known and most commonly used methodologies in usability assessment, and its integration with UX practices has proven to be effective for many companies.
The System Usability Scale questions
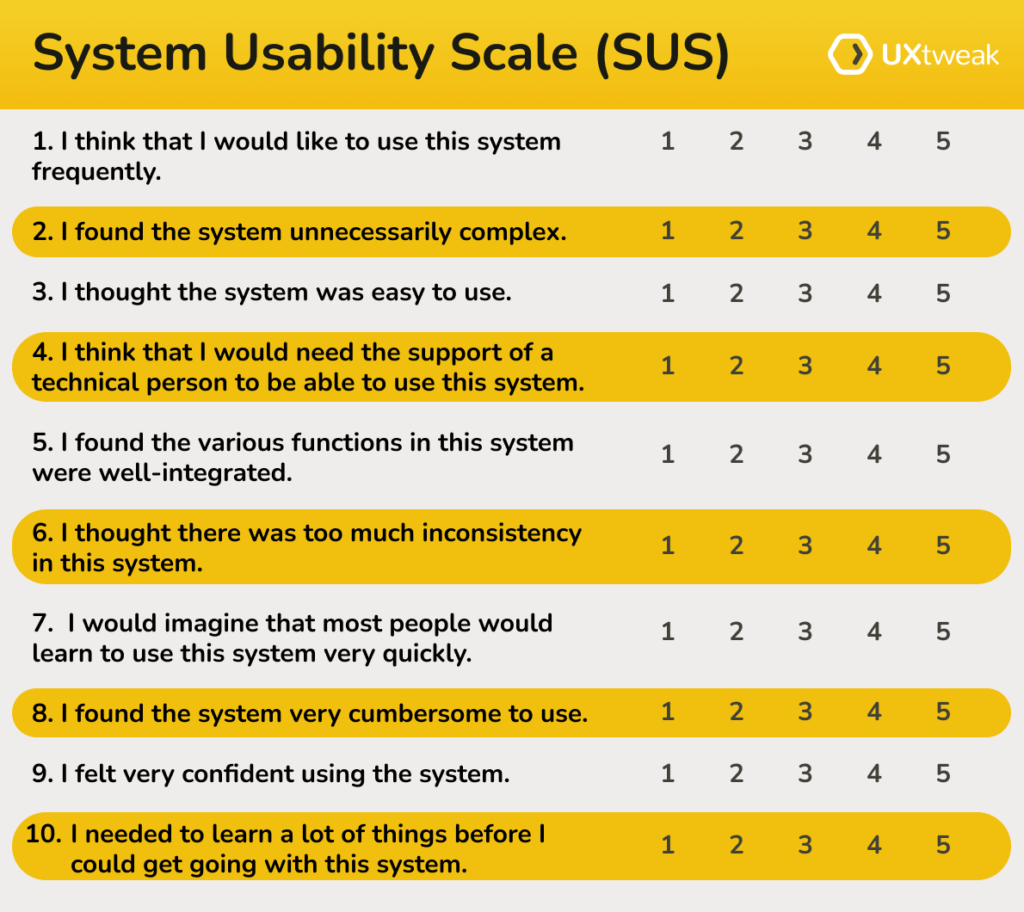
The ten statements in the system usability scale questionnaire are:
- I think that I would like to use this system frequently.
- I found the system unnecessarily complex.
- I thought the system was easy to use.
- I think that I would need the support of a technical person to be able to use this system.
- I found the various functions in this system were well-integrated.
- I thought there was too much inconsistency in this system.
- I would imagine that most people would learn to use this system very quickly.
- I found the system very cumbersome to use.
- I felt very confident using the system.
- I needed to learn a lot of things before I could get going with this system.
Questions 1, 3, 5, 7, and 9 are positively-oriented questions, using wording associated with positive statements, such as “like,” “easy,” “quickly,” and “confident.”
Questions 2, 4, 6, 8, and 10 are negatively-oriented questions, where the question and wording have negative associations like “complex,” “inconsistency,” and “cumbersome.”
This mixed approach helps capture a comprehensive perspective of a user’s experience with the application.
As participants go through the questionnaire, they rank their responses on a scale of one to five (Likert scale), where 1 = “Strongly disagree”, and 5 = “Strongly agree”. For example:
Question: I think that I would like to use this system frequently.
Possible answers:
Strongly disagree | Disagree | Neither agree nor disagree | Agree | Strongly agree |
1 | 2 | 3 | 4 | 5 |
How to calculate the SUS score?
To score the system usability scale, follow these steps after gathering responses from participants:
1. Subtract one from the user response for odd items (questions)
Take each positively-oriented question score (i.e., for questions 1, 3, 5, 7, and 9) and subtract one from the participant’s answer. Answers will range from zero to four.
2. Subtract the user responses from 5 for even-numbered items
Take each negatively-oriented question score (i.e., for question 2, 4, 6, 8, and 10) and subtract the participant’s answer from five. Answers will range from zero to four.
3. Sum up the adjusted scores
Total scores will range from 0 to 40.
4. Multiply the total score by 2.5.
This is the system usability score (SUS). Scores will range from zero to 100.
👉 This is how you get the score for one respondent.
5. Calculate the average score of all respondents
To get the overall score, take the total score of each participant and calculate the average.
(Overall SUS score = Total score of Repondent 1 + Total score of Respondent 2… + Total score of Respondent N/N)
You will use your overall SUS score as a benchmark to compare it to past and future SUS scores or with industry averages.
💡 Pro Tip
SUS represents quantitative data, we recommend collecting at least 20 – 30 responses to ensure its significance.
Scoring the SUS brings a bit of complexity, and is one of the impediments for using the system.
However, because the system usability scale has demonstrated its value experimentally for decades, there is a wide range of industry data available to benchmark results and understand them within the context of the competition.
This makes the learning curve to operating the system worthwhile.
SUS score calculator
Here we have prepared a calculator for you – a pre-prepared Excel sheet where you just copy your results, and the function will calculate your SUS score.
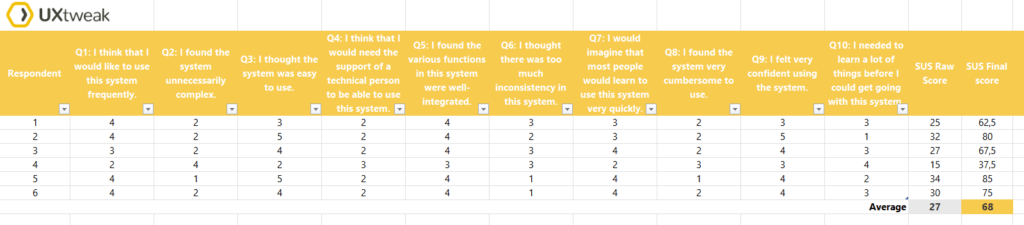
Jeff Sauro and James R. Lewis (2016) created a curved grading scale using data from 241 usability studies. In this scale, a SUS score of 68 corresponds to a “C” grade, which is average (50th percentile).
The top and bottom 15 percentiles correspond to A and F grades, respectively, with further subdivisions for A+, A, A-, and similar breakdowns for B and C grades.
💡 Pro Tip
Check out our article on the Best UX Research Books (According to Our Survey). Besides “Quantifying the User Experience,” which focuses on statistics in user research, you’ll discover other books that will deepen your knowledge of UX.
System usability scale scoring example
To better understand how to calculate an SUS score, we prepared an example.
Let’s imagine that a participant completed the SUS questionnaire following a usability test. Their responses are below:
Question Number | Participant Responses (Ranked One to Five) |
1 | 5 |
2 | 5 |
3 | 4 |
4 | 1 |
5 | 3 |
6 | 1 |
7 | 3 |
8 | 2 |
9 | 5 |
10 | 1 |
Step 1: Take each positively-oriented question score (questions 1, 3, 5, 7, and 9) and subtract one from the participant’s answer. Answers will range from zero to four.
Example:
- Participant score: 5 (Strongly agree)
- Subtract one from the participant’s answer to get four (5 – 1 = 4)
Question Number (Positively Oriented) | Participant Response (Ranked One to Five) | Adjusted Score (Response Minus One) |
1 | 5 | 4 |
3 | 4 | 3 |
5 | 3 | 2 |
7 | 3 | 2 |
9 | 5 | 4 |
Step 2: Take each negatively-oriented question score (questions 2, 4, 6, 8, and 10) and subtract the participant’s answer from five. Answers will range from zero to four.
Example:
- Participant score: 5 (Strongly agree)
- Subtract the participant’s answer from five to get zero (5 – 5 = 0)
Question Number (Negatively Oriented) | Participant Response (Ranked One to Five) | Adjusted Score (Response Minus One) |
2 | 5 | 0 |
4 | 1 | 4 |
6 | 1 | 4 |
8 | 2 | 3 |
10 | 1 | 4 |
Step 3: Sum up the adjusted scores for all items to obtain a total score. Total scores will range from zero to 40.
Question Number | Participant Response | Adjusted Score |
1 | 5 | 4 |
2 | 5 | 0 |
3 | 4 | 3 |
4 | 1 | 4 |
5 | 3 | 2 |
6 | 1 | 4 |
7 | 3 | 2 |
8 | 2 | 3 |
9 | 5 | 4 |
10 | 1 | 4 |
Total Adjusted Score | 30 |
Step 4: Multiply the total score by 2.5. This is the system usability score (SUS). Scores will range from zero to 100.
Example:
30 x 2.5 = 75 (SUS)
SUS Score | 75 |

What are the benefits of using the System Usability Scale?
The benefits of leveraging the system usability scale are multifactorial. Inherently designed to provide measurement for perceived ease-of-use for a website or application, they can provide deep insight into the following areas:
- Learnability – how easy a system is to learn.
Several questions are included in SUS to better understand how users perceive learnability with the application by exploring how easily users can grasp the system.
- Efficiency – how efficient or fast it is to use the system.
SUS can provide helpful insight into whether or not users find the application easy or cumbersome to use.
- Satisfaction – how satisfied users are with the system.
Though indirect, SUS can help explain whether or not users would regularly enjoy using the application, or if they find it complex.
SUS has a strong record of consistently being a reliable and valid tool for measuring usability. It’s shown to effectively provide valuable insights to smaller sample-size audiences, making them easier to leverage than larger commercial techniques. SUS has also proven to consistently provide valid measurements around perceived usability, meaning any researcher or team can trust the results.
It is important to note, however, that Likert scale questions also open the door to potential biases: acquiescence bias and social desirability bias. Acquiescence bias refers to people’s tendency to agree with others. Social desirability bias refers to someone’s desire to report positive views that will be received well by others.
If you want to learn more about social desirability bias and how to avoid it, watch our video guide about the most common research biases. We cover the most effective tips for reducing social desirability type of bias there. ⬇️
Things to remember when creating SUS surveys
- Do not change the order of the SUS questions
Maintaining the structure of the SUS questions when performing research is important since changing the order of the questions or scale will affect the scoring when calculating the final results. - Do not alter the wording of the questions – altering the wording of the questions can impede comparisons if SUS scores are being collected from other designs, and will make it impossible to compare your scores to industry benchmarks.
- Do not change the wording or order of the Likert scales – as mentioned earlier, changing the wording would make it impossible to compare results with results from other studies. Additionally, altering the order could confuse participants familiar with the traditional Likert scale format, where “strongly disagree” is on the left and agreement increases towards the right.
💡 Pro Tip
Adhering to the standardized SUS questionnaire ensures consistent results.
What is a good SUS score?
Jeff Sauro, PhD, has found that the average SUS score is 68. Therefore, a SUS score of 70 doesn’t mean the same thing as scoring 70% on an exam, because the 70-point SUS score is actually above average.
Additionally, a SUS score of 80.8 is actually in the top 10% of all SUS scores, which would be similar to scoring an “A” on a test (even though the score is 80 out of 100).
The table below normalizes several ranges of SUS scores by ‘grade’ in order to help better rank usability.
SUS Score | Percentile range | Grade | Rank |
84.1 - 100 | 96 – 100 | A+ | Best imaginable |
80.8 - 84.0 | 90 – 95 | A | |
78.9 - 80.7 | 85 – 89 | A- | |
77.2 – 78.8 | 80 – 84 | B+ | Excellent |
74.1 - 77.1 | 70 – 79 | B | |
72.6- 74.0 | 65 – 69 | B- | |
71.1 – 72.5 | 60 – 64 | C+ | Good |
65.0 - 71.0 | 41 – 59 | C | |
62.7 - 64.9 | 35 – 40 | C- | |
51.7 – 62.6 | 15 – 34 | D | Okay |
0 - 51.6 | 0 – 14 | F | Poor |
When it comes to interpreting SUS scores, it’s important to remember that there are also many other acceptable ways to provide meaningful comparisons – such as with percentiles, acceptability, and NPS.
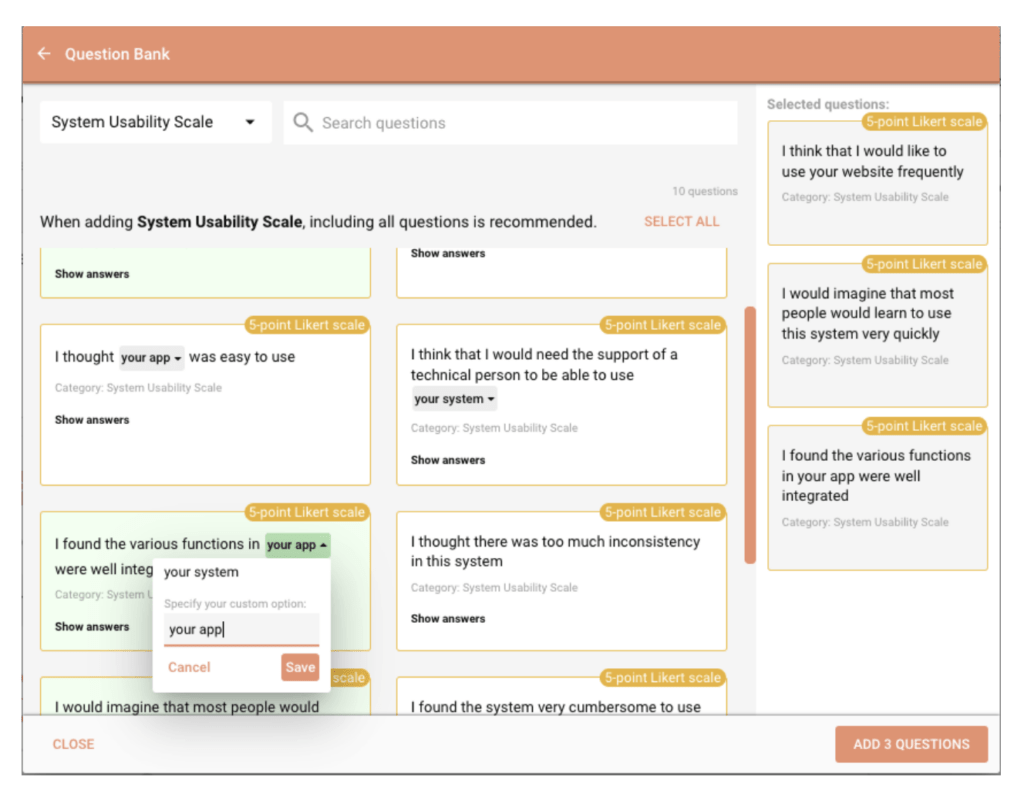
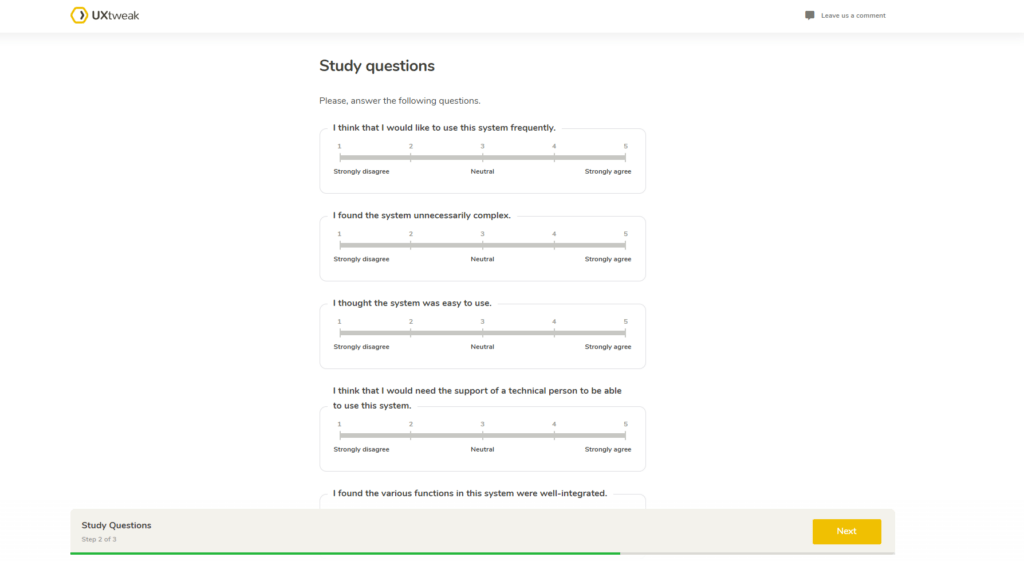
How to collect and analyze SUS with UXtweak
1. Create a survey in UXtweak by selecting the “System Usability Scale” from the Question Bank, which automatically includes all the standard SUS questions with a 5-point Likert scale.
2. Distribute the study link to participants and gather sufficient responses.
3. Calculate the SUS score in Word using the instructions in the “How to calculate the SUS score?“ section of this article, or download the pre-prepared UXtweak Excel file in the “SUS score calculator“ section.
4. Compare your results with the ratings on our blog and check the “How to interpret SUS scores“ section to assess your system’s performance.
The Future of the System Usability Scale (SUS)
The System Usability Scale (SUS) has been a cornerstone in usability testing for decades. In a 2018 paper, “The System Usability Scale: Past, Present, and Future,”
James R. Lewis emphasizes that SUS remains the most widely used standardized questionnaire for assessing perceived usability.
He predicts that SUS will continue to be a popular tool for evaluating usability in the foreseeable future.
However, our recent observations suggest a shift.
We’ve noticed that our clients (various research teams from around the world) don’t use it as much as we expected.
Intrigued, we decided to dig a bit deeper into the data
Since there are no specific statistics on the current adoption of the SUS, we turned to Google Trends for insights. By examining the interest over time for the topic “System Usability Scale” over the past five years, we aimed to uncover trends in its usage.
The interactive chart below provides a visual representation of this data:
Trends Analysis
We calculated the average interest for each year:
Year | Average interest |
2020 | 22.06 |
2021 | 24.10 |
2022 | 48.09 |
2023 | 43.09 |
2024 | 34.10 |
2025 (up to September) | 43.92 |
A notable spike from 24.10 in 2021 to 48.25 in 2022 coincides with Google Trends introducing improvements in data collection, potentially skewing the data.
Despite this anomaly, the overall trend indicates a decline in interest. From a peak in 2022, interest has dropped to 43.09 in 2023 and further to 34.10 in 2024.
Interestingly, 2026 so far shows a rebound, averaging nearly 44, suggesting renewed interest after the two-year slump.
Weekly Patterns
To identify patterns, we also analyzed weekly peaks and declines. Not surprisingly, peaks in interest typically occur early in the year (January) and in the fall (October and November).
Declines are more frequent in the middle of the year (May to July) and at the year’s end (December).
This pattern aligns with the scheduling of major holidays and vacation periods, as well as the typical project cycles observed in UX research and academic teams (researchers often have to wrap up projects before the year’s end and start new ones at the beginning of the year)
What does this mean?
While SUS remains widely recognized, the data suggest its role is changing.
The sharp rise in 2022 coincides with Google Trends’ own update to its data collection system (applied on January 1, 2022), and may also reflect heightened industry attention to usability evaluation during the pandemic and post-pandemic digital shifts.
The following decline in 2023–2024 points to a reduced search interest, which could indicate that some research teams are exploring alternative methods or tools.
Still, it’s important to note that Google Trends reflects search behavior, not necessarily actual usage. The rebound in 2026 (based on data through early September) shows that SUS has not faded away.
Its simplicity, strong benchmarking base, and decades of validation ensure it will remain a trusted metric in the researcher’s toolkit – though perhaps no longer the default choice for every project.
Is the System Usability Scale the right tool for you?
If you’re seeking to better understand how to measure the perceived usability of your website or application, leveraging the system usability scale can be a valuable approach.
However, since SUS is a post-test questionnaire, it’s important to set up and conduct usability tests beforehand.
UXtweak offers a wide array of testing options for testing your website or mobile application, suitable whether you’re in early prototype stages or have an established product already on the market. You can explore options and get started with a free trial today.
Conclusion
In summary, SUS scores are a helpful measurement to learn whether or not users find your website or app easy to use and efficient.
Additionally, it can provide a global measure of satisfaction and help provide deeper insight into particular dimensions of usability.
When it comes to today’s competitive landscape, enhancing efficiency, intuitiveness, and usability has become an order qualifier.
Begin your journey to better and more efficient systems by partnering with UXtweak and leveraging the power of SUS. 🐝

The numbers on the chart represent search interest relative to the highest point on the chart. A value of 100 signifies peak popularity for the term, while a value of 50 means the term is half as popular.