Key takeaways
⚙️ UX analytics shows where users drop off and get frustrated before problems escalate
🔀 Combine quantitative data (what’s happening) with qualitative insights (why it’s happening)
📈 Define specific goals like “reduce form drop-offs by 15%” before tracking any metrics
🤖 Use AI to detect rage clicks and cluster survey data but keep human interpretation
🛠️ Fix high-impact, low-effort issues first before tackling complex redesigns
🍯 Implement changes based on findings, then track same metrics to measure improvement
UX analytics is usually what teams turn to after something breaks. Sign-ups drop. Users stop engaging. A shiny new feature flops. And suddenly, everyone’s trying to figure out what went wrong.
The problem? Most teams don’t have a clear view of how users are actually interacting with their product, until it’s too late.
That’s the pain UX analytics solves. It shows you exactly where users drop off, what frustrates them, and which parts of your experience are slowly leaking conversions.
In this guide, we’ll walk you through what UX analytics really is, how to get started (even if you’re new), and which tools (AI-powered or otherwise) can help you make better product decisions before problems spiral.
What is UX Analytics

UX analytics is the process of collecting and analyzing user data to understand how people interact with a digital product. It digs into things like where users click, where they get stuck, and what makes them drop off.
You’re not just looking at numbers, you’re uncovering stories behind user behavior. With the right insights, you can fix what’s frustrating, double down on what works, and create smoother, more enjoyable experiences.
This need for intuitive user experiences has never been more critical.
Modern users, especially younger generations, have incredibly high expectations for digital products. In fact, 70% of Gen Z users want websites to intuitively know what they want.
Therefore, teams now need concrete data to create the seamless, predictive experiences users expect.
Qualitative VS Quantitative UX analysis methods
Quantitative UX analysis is all about the numbers. It focuses on measurable data, things like how many users clicked a button, how long they stayed on a page, or how often they completed a task.
This type of analysis helps you spot patterns at scale and answer questions like “how many” or “how often.”
Common methods include surveys (especially with closed-ended questions), A/B testing, heatmaps, analytics tools (like Google Analytics), and usability metrics.
Some key metrics to track for quantitative UX analysis include:
👉 Task success rate
👉 Error rate
👉 Time on task
👉 Bounce rate
👉 Click-through rate (CTR)
👉 Net Promoter Score (NPS)
Qualitative UX analysis, on the other hand, digs into the why behind user behavior. It’s about understanding emotions, motivations, and struggles by observing real users or hearing directly from them.
It gives you deeper insights into how users feel about their experience, even if it’s just a small group.
Methods include user interviews, usability testing, session recordings, open-ended survey questions, and field studies.
Both methods serve different purposes and when used together, they give you a fuller picture of your user experience.
While quantitative UX analytics tells you what is happening at scale, qualitative analysis explains why it’s happening, even if on a smaller scale.
Quantitative vs Qualitative UX Analytics: A quick comparison
Aspect | Quantitative UX Analysis | Qualitative UX Analysis |
Focus | What users do (measurable behavior) | Why users do it (emotions, motivations, context) |
Data type | Numerical, statistical | Descriptive, observational |
Sample size | Large groups, scalable | Small groups, in-depth |
Common methods | Surveys (closed-ended), A/B testing, analytics tools | Interviews, usability testing, session recordings |
Best for | Identifying patterns and trends | Exploring pain points and user thought processes |
💡 Pro Tip
For more insights, read this article on Quantitative vs. Qualitative UX Research.
How to start with UX Analytics
Getting started with UX analytics isn’t about tracking everything, it’s about asking the right questions, choosing the right metrics, and using data to uncover what your users actually need. Here’s how:
📍Step 1: Define your UX goals
Before you start tracking anything, ask: What are we trying to improve?
Your goal could be reducing drop-offs on a checkout page, increasing sign-ups, or making onboarding smoother. Be specific. A good goal sounds like:
- “Increase task completion rate on the new dashboard”
- “Reduce form drop-offs by 15% during registration”
- “Identify blockers in the first-time user experience”
💡 Pro Tip
Tie your UX goals to business outcomes like retention, activation, or conversion.
📍Step 2: Choose the right metrics and methods
Once your goal is defined, the next question is: How will we know if we’re making progress?
That’s where metrics come in. Depending on what you’re trying to achieve, you’ll need a mix of quantitative and qualitative methods to get the full picture.
Say your goal is to improve conversions on a landing page, you’d want to track things like:
- Click-through rate (CTR)
- Bounce rate
- Time on page
- Scroll depth
But if you want to understand why users are leaving, numbers alone won’t cut it. You’ll need qualitative methods like:
- Watching session recordings to spot hesitation points
- Running usability tests to see where users get confused
- Asking open-ended survey questions to surface real user feedback
Think of it like this: quantitative tells you what’s happening, qualitative tells you why. The magic happens when you use both together.
If you’re unsure which metrics to start with, this guide to UX metrics breaks down the most useful ones based on different UX goals, helping you track what really matters.
💡 Pro Tip
Metrics need context. A high bounce rate alone doesn’t mean bad UX. In a Reddit discussion, one Redditor pointed out that issues like a broken layout on a specific browser can spike bounce rates. Always look at metrics in relation to user goals and flow, not in isolation.
📍Step 3: Pick your tools
Now it’s time to choose the tools that will help you collect and analyze the right data.
Don’t just Google “UX analytics tools” and go with the first result. The right tool depends on your specific use case, team size, tech stack, and workflow preferences.
Here are a few guiding questions to help you choose:
👉 Do you need to observe users in real time, or analyze patterns over time?
👉 Are you looking to collect quantitative data, qualitative insights, or both?
👉 Will you be testing prototypes or live websites/apps?
👉 Do you need participant recruitment and panel management features?
👉 How important is it for the tool to integrate with your existing stack (like Figma, Slack, or Jira)?
Ideally, look for a solution that combines both qualitative and quantitative capabilities in one place. That way, you’re not constantly switching between tools or stitching together insights from five different dashboards.
This is where a platform like UXtweak really shines — it brings together both qualitative and quantitative methods, helps with recruiting the right participants, and fits well into common product and design workflows.
It’s especially useful if you want something that grows with your research needs, from early-stage prototype testing to live product insights. 🐝
📍Step-4: Analyze, prioritize, and act
Collecting data is the easy part. The real value of UX analytics comes from how you interpret it and what you do next.
Start by reviewing both the numbers and the narratives.
Are users consistently dropping off at a particular step? Are session recordings revealing moments of hesitation or rage clicks? Are interview participants mentioning the same pain points again and again?
Once patterns emerge, prioritize your findings based on two factors: impact and effort.
- Impact looks at how many users are affected and how severely
- Effort considers how much time or resources it will take to address the issue
Fixing a broken button on a key page? High impact, low effort. Redesigning your entire onboarding? Probably high effort, so weigh it against how much it’s hurting user retention.
After that, it’s about closing the loop. Implement your changes, then track the same metrics again to see what’s improved.
📚 Are you running a UX course?
Give your students free access to UXtweak with our Education Program.
We support:
-
University courses
-
Online courses & bootcamps
-
Independent educators & mentors
Apply today and bring hands-on UX research tools into your curriculum! 🐝
UX analytics and AI

These words from UX researcher Tina Ličková hit especially hard when we talk about UX analytics powered by AI:
Get an understanding of AI and its effect on humanity, and do not panic… We need to redefine our roles and figure out how to remind people around us that it’s people, not technology, who should come first.
Here’s how to use it right:
💡 Spot frustration without watching 200 recordings
You don’t need to sift through every session to find out where users are getting stuck.
AI can automatically detect behaviors like rage clicks, rapid scrolling, or repeated interactions with unresponsive elements, signs that something’s gone wrong.
This gives you an instant shortlist of “problem spots,” so instead of scrubbing through hours of footage, you can jump straight to the moments that need attention.
Tools like UXtweak use AI functionalities to identify these areas automatically, create transcripts, and help researchers dig deeper.
Once you’ve identified rage clicks or confusion points, you can export session transcripts, user comments, or observation notes and drop them into AI tools to make sense of them at scale.
This combo, AI-powered session detection plus AI analysis using ChatGPT or Claude, lets you go from raw behavior to actionable insight in record time.
💡 Turn messy survey data into clean, clustered insights
Open-text survey responses are often rich but chaotic. Reading through dozens or hundreds of responses can take hours, and even then, important patterns might be missed.
Drop those open-ended responses into ChatGPT or Claude and use targeted prompts to extract clarity from the chaos.
📌 Example:
- “Group these responses into 3–5 major themes. Label each one clearly.”
- “Highlight the most common frustrations mentioned in this feedback.”
- “Summarize the emotional tone of these responses: are users confused, annoyed, satisfied?”
It will help you quickly identify what matters most to users, spot trends, and even surface outlier opinions you might otherwise overlook.
💡 Analyze user journeys and find drop-off triggers
Numbers can tell you where users drop off, but not why. That’s where AI helps.
Feed user journey logs or funnel drop-off notes into ChatGPT or Claude and get qualitative insights to guide your next steps.
📌 Example:
- “Why might users be abandoning this flow after step 3?”
- “Compare the successful and failed user paths, what’s different?”
- “Suggest hypotheses for improving this conversion funnel based on these behaviors.”
That’s how you’re not just tracking where users leave, you’re understanding what might push them away.
💡 Pro Tip
Use analytics to ask better questions. One senior UXer on Reddit put it best: “Analytics tell you what people do. Other methods tell you why.”
Use patterns in tools like GA to spark deeper questions, then follow up with interviews, usability tests, or surveys to uncover the real story. (Read the full reply)
💡 Benchmark competitor UX
Analyzing competitor UX often ends up as a subjective game of “looks better” or “feels smoother.” AI brings structure to the process.
Take screenshots, user flows, or even copied website copy from competitors and prompt ChatGPT or Claude to evaluate them through a UX lens.
📌 Example:
- “Evaluate this interface. What usability best practices does it follow?”
- “Based on this layout, what might confuse a first-time user?”
- “How does this design differ from ours in terms of clarity and accessibility?”
It will help you turn competitive analysis into something more analytical and actionable, without a giant team under your belt.
💡 Draft smarter usability tests and interview questions
AI isn’t just good at analyzing data, it can also help you design better research.
After identifying a specific user behavior or issue, you can ask ChatGPT or Claude to help you design interview questions, usability tasks, or even A/B test ideas.
📌 Example:
- “Based on this user feedback, write 3 usability tasks to test their expectations.”
- “Craft follow-up questions that dig deeper into this hesitation point.”
- “Suggest ways to validate this hypothesis through user research.”
That’s how you waste less time on generic questions and go into research sessions with more focus and depth.
💡 Pro Tip
If you’re curious about more ways AI can support your research process, here’s a solid roundup of the best AI tools for UX research that breaks down their strengths and use cases in detail.
Best AI tools for UX analysis
Let’s now jump to some of the best AI tools that can help speed up and improve your UX analysis:
UXtweak
UXtweak blends behavioral analytics with AI to help you uncover friction without watching hours of recordings. It automatically flags rage clicks, hesitation points, and dead ends in user sessions, then generates transcripts and even helps you refine your research questions.
It’s especially helpful when you’re working with large volumes of session data and need to prioritize the most critical issues first.
With UXtweak, you go from “where users got stuck” to “why they got stuck” fast.
Key features
- Evaluate how users complete tasks on prototypes or live sites to uncover friction and drop-offs through website usability testing.
- Visualize where users interact most or abandon using heatmaps (click, move, scroll), helping you optimize layout and content hierarchy faster
- Watch how users navigate and react during tasks through session replays with screen, face, and voice recordings
- Test and refine your site’s navigation structure using card sorting and tree testing to improve findability and reduce user confusion
- Gather user sentiment and preferences through logic-based surveys and preference tests that adapt based on user responses
🔽 Try UXtweak’s session recording and preference testing tools yourself!
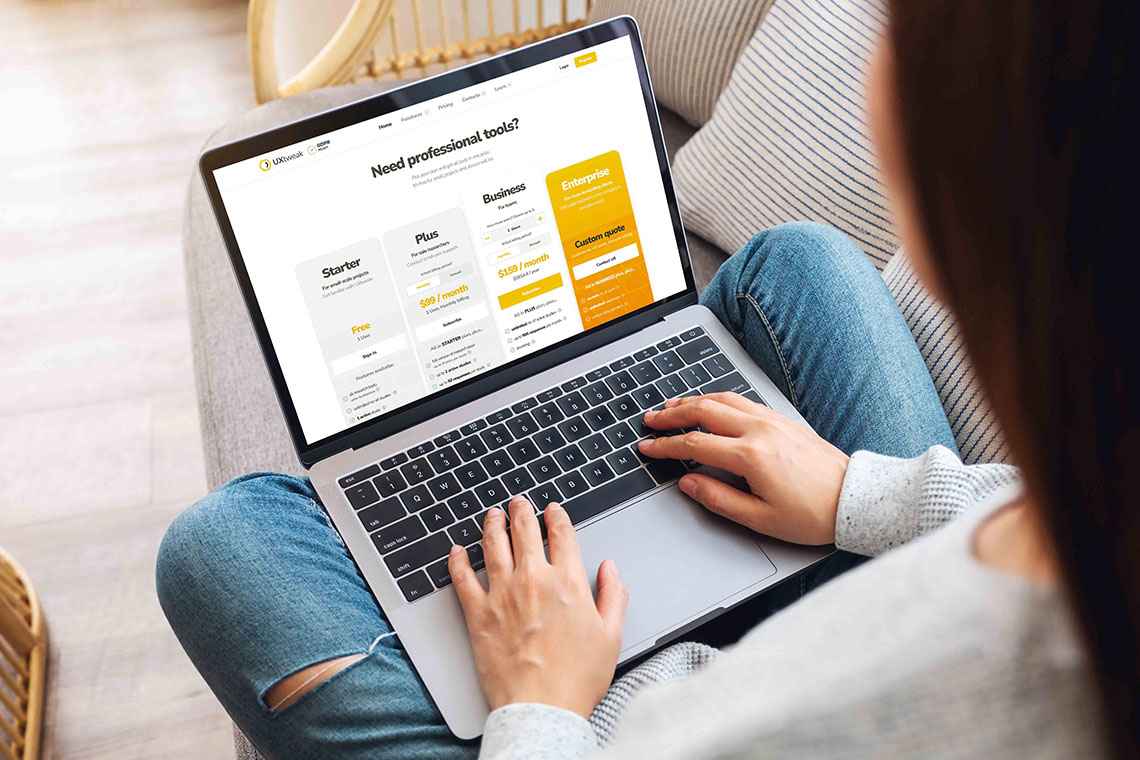

UXtweak pricing and plans
Custom Plan (Pricing upon request) – Tailored for organizations with advanced research needs, providing unlimited active studies, customizable responses, live interviews, access to a global user panel and much more.
Free Plan (€0/month) – A great way to experiment with UX research tools at no cost. Includes access to all tools, 15 responses/month, 1 active study, and 14-day access to results.
Business Plan (€92/month, billed annually) – Ideal for teams that require essential UX research tools and features for their projects. Includes 50 responses/month (upgradable), 1 active study (upgradable), unlimited tasks per study, 12-month data retention, reports and video exports.
ChatGPT
ChatGPT isn’t just a chatbot; it’s a powerful analysis partner. Feed it messy survey responses, user interview transcripts, or even observation notes, and it’ll cluster themes, summarize sentiment, and surface hidden patterns.
You can also use it to draft usability tests or follow-up interview questions based on real user behaviors.
Key features
- Summarize themes and pain points using AI-powered analysis of transcripts
- Group similar feedback using natural language understanding to speed up insights
- Draft better research questions using prompts tailored to real user behavior
- Extract insights from messy data using flexible, context-aware prompts
Microsoft Clarity
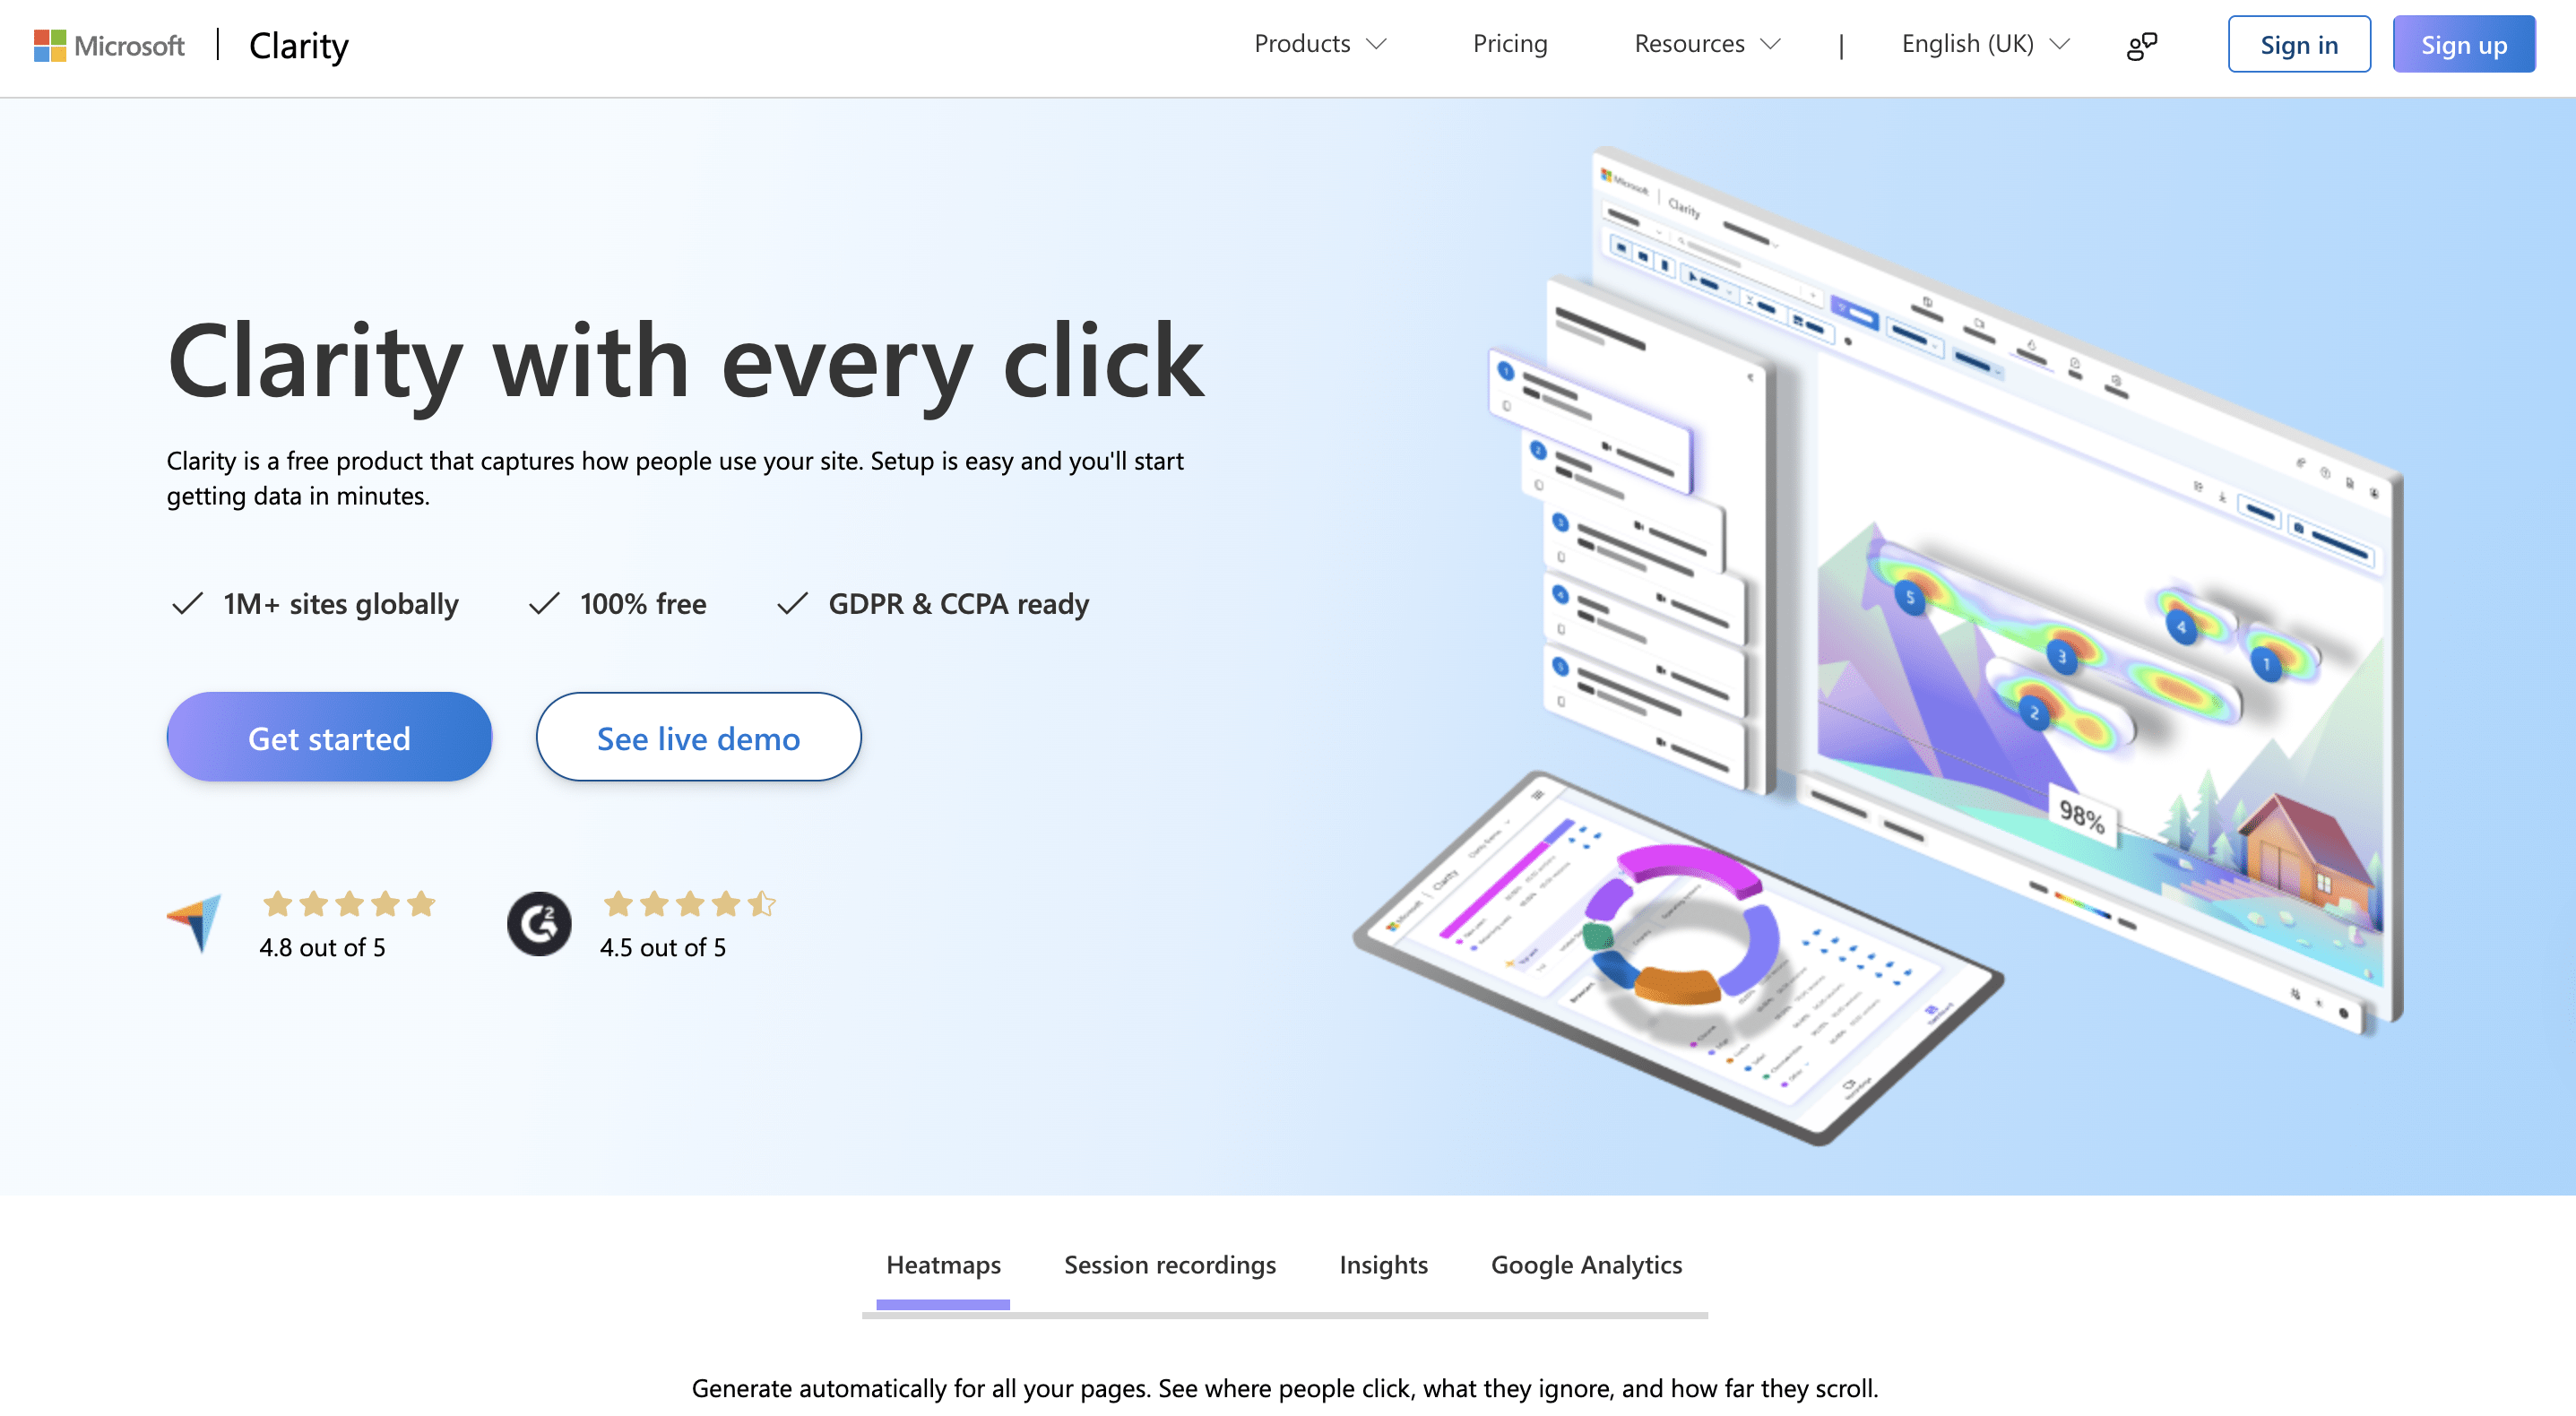
Microsoft Clarity is a free, privacy-compliant analytics tool that delivers session recordings, heatmaps, and AI-powered filters out of the box.
What makes it stand out is its automatic surfacing of frustration signals, like rapid clicks, dead clicks, and erratic scrolling, so you don’t have to go hunting for issues manually.
It’s good for identifying high-impact usability problems at scale, especially if you’re strapped for time or working solo.
Key features
- Spot friction points instantly using auto-detected rage clicks and scroll depth tracking
- Scan user journeys faster using AI-tagged session recordings
- Zoom into segments easily using filters for device type, behavior, and pages
- Use it without budget concerns thanks to its forever-free pricing model
Attention Insight
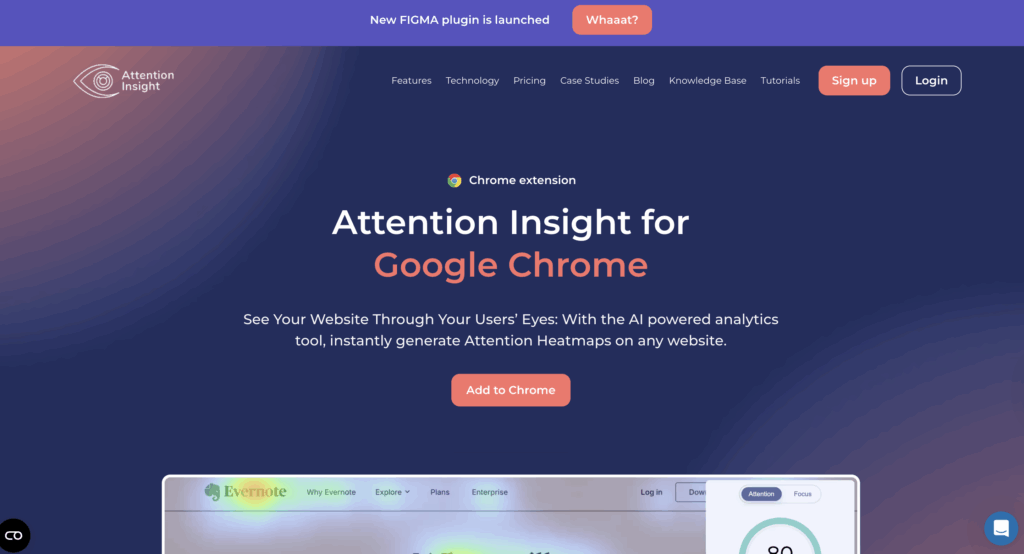
Before users ever interact with your design, Attention Insight predicts where their eyes will go. It uses AI-powered heatmaps and attention scoring to forecast which elements are likely to draw focus, like CTAs, headlines, or product images.
That’s how it helps you test and iterate on visual hierarchy early in the design phase, and cut costly post-launch revisions
Key features
- Predict user focus areas using AI-generated attention heatmaps
- Check visual hierarchy clarity using attention scores per element
- Compare design versions side by side using A/B layout testing
- Test layouts before launch using simulated pre-launch feedback
Common concerns of UX analysts
Here are some common concerns UX analysts often come across:
⚠️ Resistance to research
This one’s a classic. You walk into a project excited to dive into user behavior, and someone from the team hits you with: “We already know what our users want.”
Resistance to research usually crops up when teams are racing against deadlines, have strong internal opinions (often from stakeholders with a loud voice), or just haven’t seen the value of UX research play out before.
The logic often goes: “Why spend time validating when we can just build and ship?”
But skipping research is like skipping the blueprint when building a house. You might get lucky, but chances are you’ll end up with doors that open into walls.
A common pattern analysts face is being brought in after the product decisions have already been made, just to “validate” what’s already been built.
By then, it’s not research. It’s damage control. Teams need to understand that research isn’t a luxury or a delay, it’s a cost-saving measure. It prevents time wasted on guesses and post-launch fixes.
💡 Pro Tip
Check out UXtweak’s report to learn how to deal with resistance to UX research.
⚠️ Overreliance on AI
AI is the shiny new toy in the UX world, and it’s definitely powerful. It can synthesize large amounts of data, cluster responses, highlight patterns, even generate usability insights.
But here’s the catch: AI doesn’t think like a human.
It doesn’t understand context, nuance, or emotion the way a researcher does. It doesn’t notice when a user hesitates before clicking, or why someone smirks while struggling with a checkout flow.
And worse, what if your input data is messy, incomplete, or biased? AI will confidently give you garbage in a gold wrapper.
We’ve seen teams plug user feedback into AI tools, get a few surface-level insights, and make product decisions without ever watching a single session or talking to a real user.
AI can be a great assistant, but it shouldn’t be your strategy.
Analysts still need to interpret, challenge, and cross-check what these tools spit out.
⚠️ Low UX maturity
Trying to do UX analysis in a low-maturity organization is like trying to plant a garden on concrete. No one’s hostile, but no one really gets what you’re doing either.
UX is often lumped under “design” or seen as a nice-to-have instead of a decision-making engine.
In organizations with low UX maturity, you’ll notice a few patterns:
- Research budgets are non-existent
- Designers are expected to wear five hats, including analysts
- The C-suite never asks for data, they ask for faster delivery
In these environments, UX analysts often have to become educators first. You’re not just presenting findings, you’re explaining why those findings matter, how they impact business goals, and why investing in user insights leads to better outcomes.
💡 Pro Tip
Small wins help here. Tie your insights directly to a KPI, say, improving a drop-off in the sign-up flow, and suddenly, people start paying attention. Show, don’t just tell.
⚠️ Siloed teams, siloed insights
Even when solid research is done, it doesn’t always travel. UX analysts often find themselves shouting into the void, sharing reports no one reads, or insights that never leave the design team’s Figma file.
That’s where the same user problems keep resurfacing, and different teams solve them in completely disconnected ways.
Let’s say support keeps hearing users are confused about pricing tiers.
Marketing has a campaign running that overpromises features. Sales has created a workaround. And product? They haven’t heard a word about any of this.
That’s what silos do, they trap insights where they’re least useful.
Good UX analysis deserves visibility.
But that requires more than just documentation, it takes storytelling. It takes looping in stakeholders early, making insights digestible, and turning research into action plans.
How to deal with resistance to research

If resistance to research is something you’re constantly bumping into, you’re not alone and you’re not helpless.
In our latest podcast episode, UXtweak’s Head of Growth, Tadeas, dives deep into why teams push back on UX research and how to turn that resistance into buy-in.
🎧 Listen to the episode on Spotify
Here are a few strategies that help:
- Frame research as a shortcut, not a slowdown: Make the case that UX research prevents rework. Highlight how fixing a problem post-launch is way more expensive than catching it early
- Bring the pain points to life: Clip a 10-second user struggle from a session recording and show it in a stakeholder meeting. Nothing shifts priorities faster than watching someone rage-click
- Quantify the value: If you’ve done past research that helped move a key metric, like reducing churn, increasing sign-up rates, or boosting NPS, showcase those wins
- Start small: A quick usability test or short survey can go a long way in proving the power of research, especially in low-UX-maturity orgs
Remember that the goal isn’t to win an argument, it’s to build trust. Once teams experience how research makes their jobs easier, resistance tends to melt away.
Helpful resources for future UX data analysts
Just getting started with UX analytics or looking to sharpen your skills? These hand-picked resources will help you build a solid foundation, whether you’re into reading, taking courses, or tuning in on the go.
📚 Unleashing the power of UX Analytics
If you’re looking for a practical, real-world guide to making sense of UX data, this book is a great place to start. It breaks down everything from techniques to strategy, without drowning you in jargon. You can grab a copy here on Amazon.
👩🏻🏫 Data-Driven Design: Quantitative Research for UX
Offered by the Interaction Design Foundation, this beginner-friendly course is perfect if you’re coming from a design background and want to get more confident with data.
It teaches how to run large-scale UX studies and analyze quantitative feedback. You can explore the course here.
🎓 UX Research at Scale: Surveys, Analytics & Online Testing
This Coursera course by the University of Michigan is tailored for budding UX researchers who want to go deeper into analytics.
It covers survey design, A/B testing, and online behavior analysis. You can take the course on Coursera to build a more data-focused research workflow.
🎧 UXR Geeks (Podcast)
Hosted by our very own Tina Ličková, this podcast brings honest, down-to-earth conversations about UX research, from career decisions to methods, mindsets, and mess-ups. It’s an easy listen for anyone trying to grow in the field.
You can listen to UXR Geeks here or wherever you get your podcasts.
Wrapping up
UX analytics is no longer just about numbers on a dashboard; it’s about translating behavior into better experiences. Whether you’re just starting out or looking to deepen your skills, combining smart tools, strong fundamentals, and a curious mindset will take you far.
If you’re looking for an all-in-one platform to help you put these ideas into action, UXtweak is a great place to start.
From heatmaps and session replays to card sorting and AI-assisted insights, it gives you everything you need to understand why users behave the way they do, and how to design better because of it.
Try UXtweak for free today and start implementing your UX insights. 🐝


📌 Example: