
Key takeaways
💡 User research analysis is the process of interpreting data and insights collected during the user research stage.
🔦 In user research analysis, the data that we analyze generally falls under two categories: qualitative and quantitative data.
🔎 UX research analysis and UX research synthesis are two distinct processes that serve distinct roles within the UX research process.
📊 Thematic analysis, affinity diagramming, and the 5 Whys technique are some of the key user research analysis methodologies.
🍯 During the analysis process, it is ideal to use both AI analysis and human interpretation.
If you’re looking to incorporate UX research analysis into your product lifecycle, then keep reading..
In this article, we have collected everything you need to know about UX research analysis, including top user research analysis methods as well as tried-and-tested tools and tips to execute user research analysis without a hitch.
Let’s get started!
What is user research analysis?

User research analysis is the process of interpreting as well as drawing conclusions from the data and insights collected during the user research stage.
It helps product teams discover unmet needs, patterns in user behavior, as well as validate design decisions with insights from real users.
The effectiveness of the user research analysis lies in the deeper understanding of the user experience, which can then aid product teams in building more intuitive and user-centered products.
During the user research analysis, researchers are trying to answer some of the following key questions:
👉 What are users’ main pain points or needs?
👉 Are there any trends or themes identified in the user behavior?
👉 Are there any aspects of the interface that create friction, and why?
👉 Which aspects of the product meet and exceed user expectations?
Types of data we analyze
In user research analysis, the data that we analyze generally falls under two categories: qualitative and quantitative data.
While both are essential for a holistic understanding of the user experience, they have distinct characteristics.
Qualitative data
Qualitative data aid researchers in understanding the motivations and emotions underlying human behavior, and they can be collected through the following user research methods:
- User interviews
- Usability testing
- Field studies
- Contextual inquiries
- Surveys with open-ended questions
- Diary studies
Quantitative data
On the other hand, quantitative data can help teams track user behavior and validate assumptions at scale. This type of data can be collected through the following key user research methodologies:
- Online surveys
- A/B testing
- Website heatmaps
- Click tracking
💡 Pro Tip
Learn more about the differences between quantitative vs. qualitative UX research in this guide.
UX research analysis vs UX research synthesis
UX research analysis and UX research synthesis are two distinct processes that serve distinct roles within the UX research process.
On one hand, UX research analysis refers to the translation of raw data into a more structured format, and it’s all about uncovering the story that the data has to tell in an organized and objective manner.
On the other hand, UX research synthesis is about combining these findings to paint the picture of a broader narrative that can inform the design decisions.
Main UX research analysis methods
Here are the key user research analysis methods that you need to master:
Thematic analysis
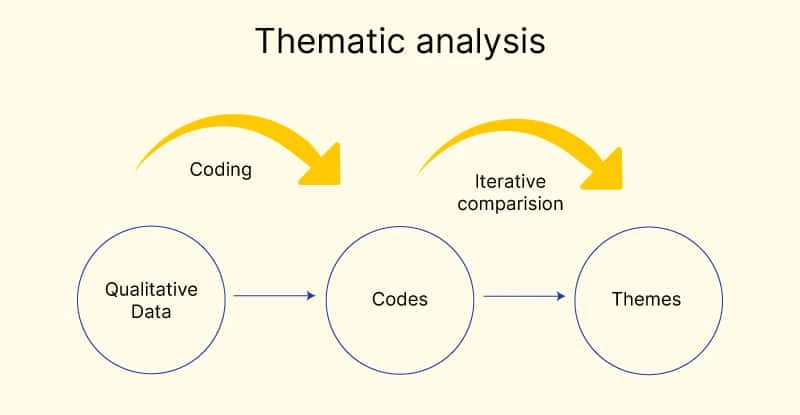
Thematic analysis is one of the key qualitative research methods that is primarily used to uncover recurring themes in user feedback.
Thematic analysis occurs after the collection of qualitative data through a range of methods, such as user interviews, usability testing, or diary studies.
It involves researchers looking into the recordings to uncover meaningful pieces of information.
With the help of digital tools or spreadsheets, these insights are then coded into categories that can reflect user emotions, pain points, motivations, or even recurring themes.
📌 Example: a category could be ‘ unclear navigation’ or ‘ inability to locate the next step in the process’. Thematic analysis is extremely valuable when it comes to exploring user needs in the early stage of product research, as it can help the product teams uncover the ‘why’ behind user behavior.
Affinity mapping
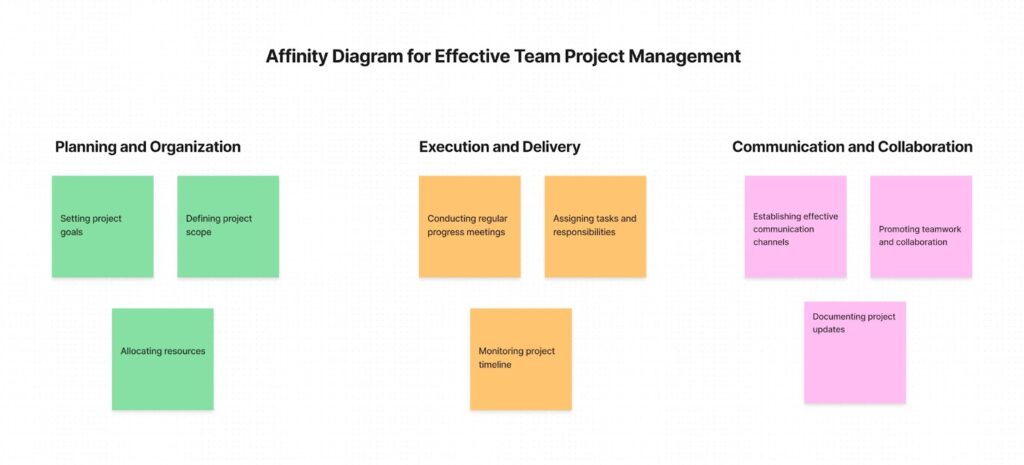
Affinity mapping is another valuable method that is used to visually organize qualitative data into categories or clusters of insights.
This type of analysis also cares about gathering information from user interviews, contextual inquiries, market research, or responses from open-ended survey questions, which are written on sticky notes or digital versions of them.
The research team then collaboratively organizes those into meaningful categories based on similarity, revealing recurring themes or patterns among the data.
This collaborative approach makes affinity mapping a great tool for cross-functional teams that are looking to align on key findings and co-create solutions based on user feedback.
Contrary to the traditional thematic analysis, affinity mapping encourages creative UX research synthesis and collaboration.
The 5 Whys technique
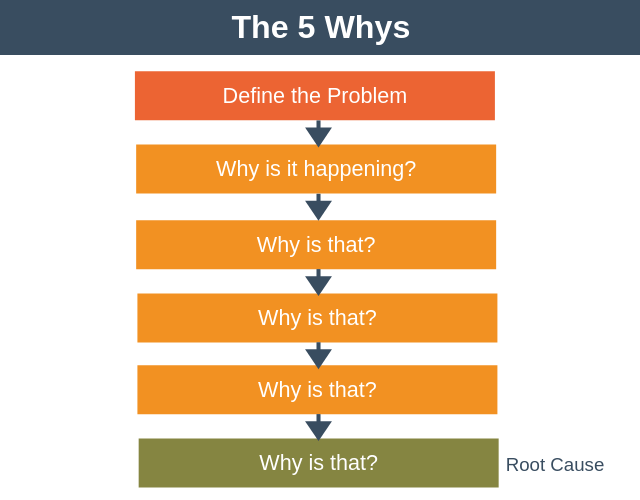
The 5 Whys technique is another great analysis tool that allows researchers to drill down to the root cause of a problem.
This method comes especially handy in usability testing or in the context of in-depth user interviews, where users are found to experience specific frustrations.
The 5 Whys technique is a simple yet profound method that involves asking why five times to peel off the layers of a problem and identify its root cause.
📌 Example: if during a usability test the user fails to complete a certain task, the researcher can pull the five technique card to better understand where the discrepancy between the user behavior and the interface lies.
This technique is great for drilling into the behavioral side of human-computer interaction or to solve repetitive user problems.
User journey mapping
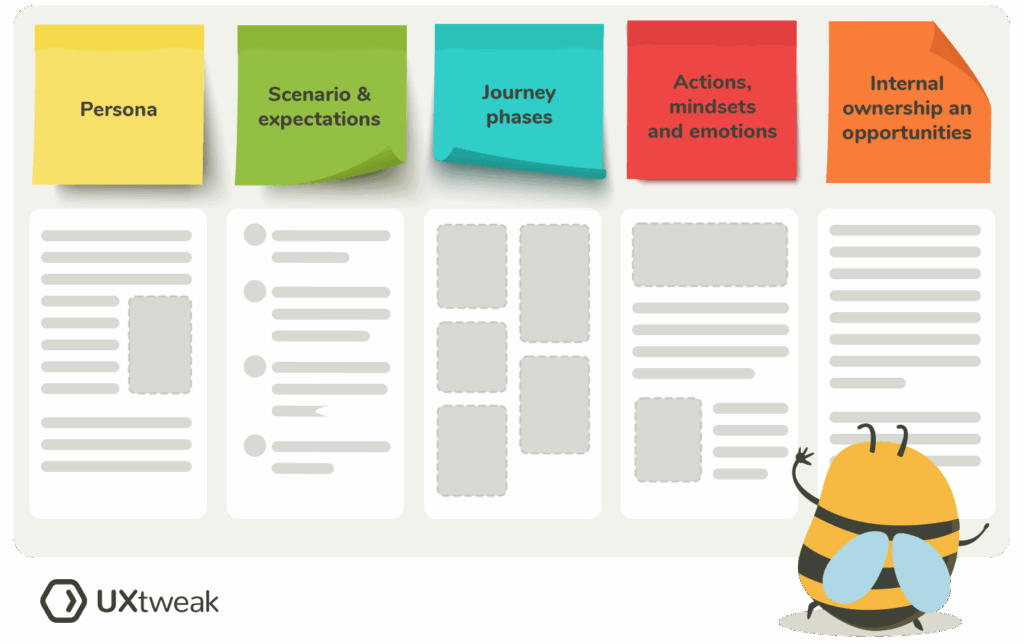
User journey mapping is an analysis methodology that is used to map out the different touchpoints that make up the user experience.
User journey mapping combines both qualitative and quantitative data.
📌 Example: researchers might take into consideration analytics data or data from survey feedback and combine it with usability testing transcripts or user feedback gained from in-depth interviews to paint a holistic picture of the user’s path from brand awareness to the final task completion.
This is a great tool to identify those touchpoints that are exceeding user expectations, as well as identify opportunities for improvement across the experience.
💡 Pro Tip
Learn how to create a user journey map template in this guide.
Comparative analysis
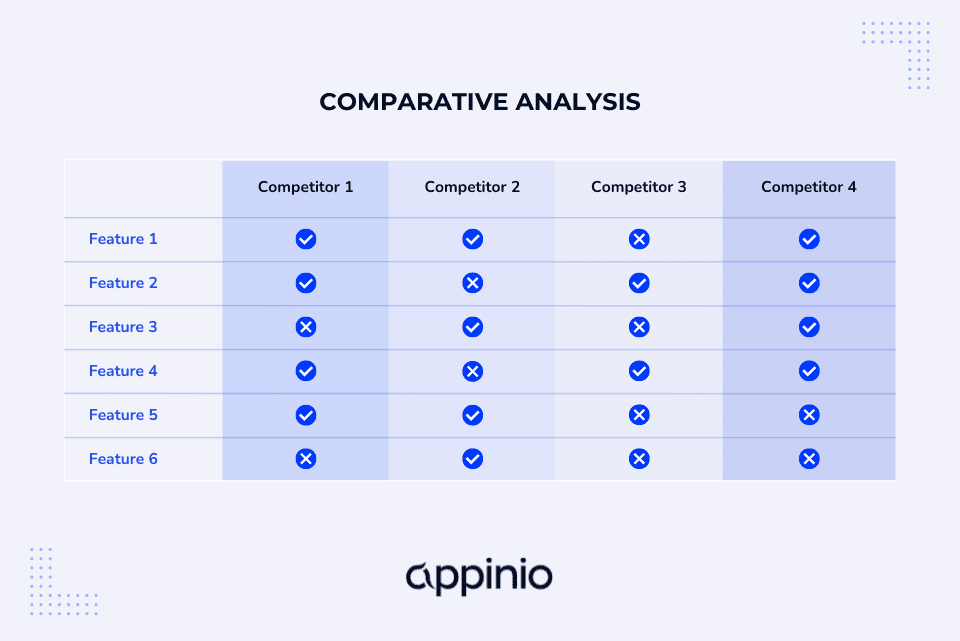
Comparative analysis revolves around assessing two or more products to understand their differences when it comes to usability, as well as determining the strengths and weaknesses that each of them has.
Typically, the comparative analysis happens between your product and that of a competitor.
It primarily uses quantitative data gathered through multivariate or A/B testing, usability benchmarks, or other industry standards and KPIs.
🔽 Try UXtweak’s A/B testing and website usability testing tools yourself!
The main purpose of this analysis is to help you identify what areas of the product experience are more effective when compared to other similar products.
Comparative analysis can be extremely handy to identify competitive differentiators and prioritize features to enhance your unique selling proposition and delight users.
Funnel analysis
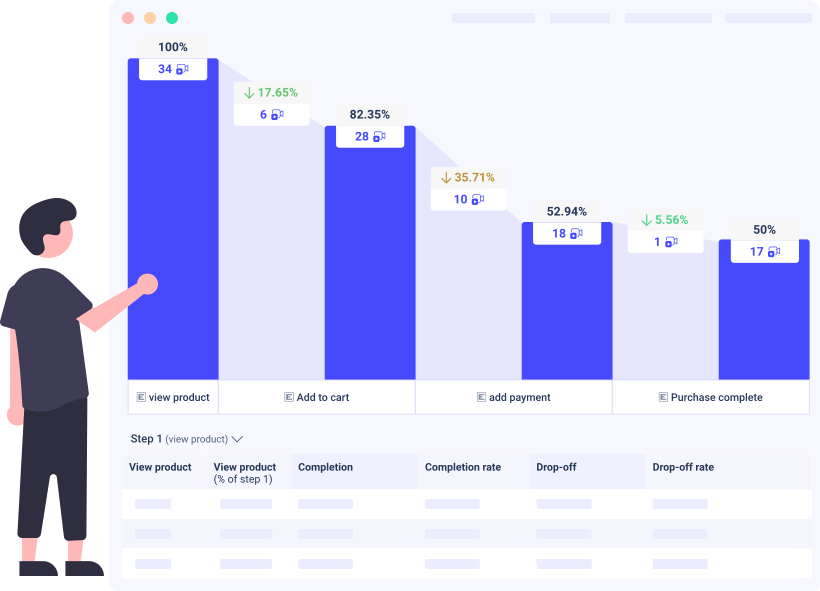
Funnel analysis is a quantitative method that maps out the steps the user needs to take to complete a task or a goal, such as completing a formal line or making a bird taste.
Funnel analysis is typically used in analytics tools as a way to optimize one’s conversion rate and understand how the user behaves in each step of the process.
This visualization helps researchers understand how many users progress or drop off between the steps.
Finally, it helps uncover the areas where friction might be the reason why users are dropping off.
Predictive modeling
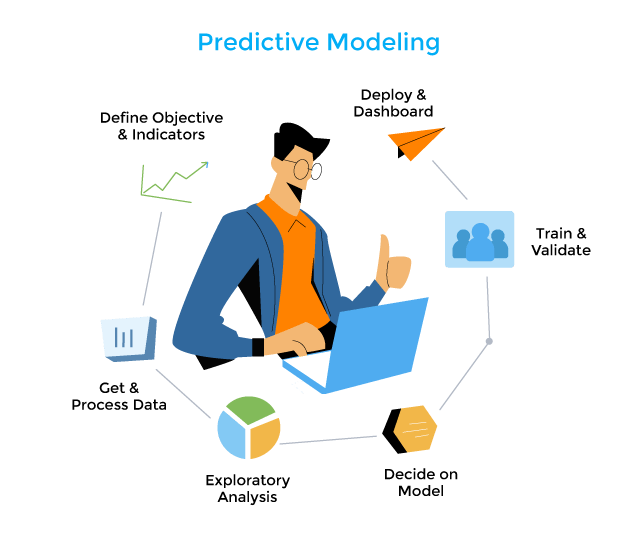
Predictive modeling is a statistical or machine learning technique that uses historical user data to predict future user behavior.
In essence, this method is a qualitative analysis that uses data collected from various analytic platforms or user behavior tracking.
The main purpose of this analysis is to identify historical patterns that can indicate how users are likely to behave in the future.
With the rise of machine learning and AI, predictive modeling is a new, exciting tool in researchers’ arsenal that can help teams proactively design experiences to match ever-evolving user needs.
💡 Pro Tip
You can use predictive modeling to forecast user behavior based on past interactions—ideal for proactively shaping user experiences with data-driven insights.
Correlation analysis
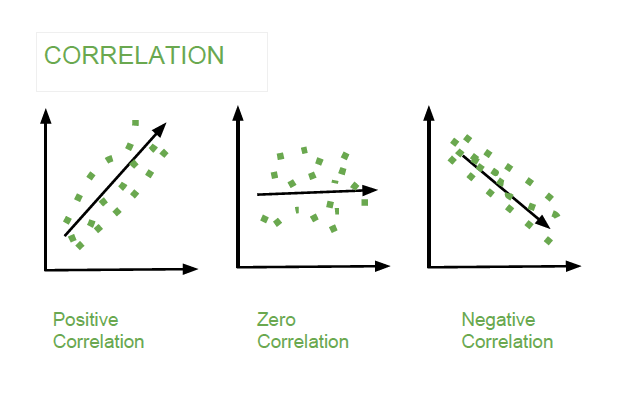
Correlation analysis is another statistical method that is used to show how two variables are related. It is commonly used in UX research to validate some assumptions penetrating user behavior.
This is a method that relies on data that is collected through online surveys and analytic tools, or performance metrics.
📌 Example: UX researchers may want to determine whether there is a relationship between the time spent on a task and user satisfaction. Typically, a positive correlation suggests that by increasing one variable, the other improves and vice versa.
When used thoughtfully, correlation analysis can help researchers perform targeted design experiments.
Using AI for user research analysis

The advancements in artificial intelligence can be greatly beneficial for user research analysis, as they can help automate repeated tasks, large databases, and speed up the research analysis process overall.
AI in UX research has a ton of practical applications in user research, especially around summarization of transcripts from user interviews, sentiment analysis through natural language processing, and behavioral pattern detection.
However, AI in UX research comes with its challenges, as learning models can be trained with biased datasets and hence produce biased interpretations.
On top of that, AI might overlook contextual cues in the context of qualitative data. Hence, to get the best of both worlds, it’s always a good idea to use both AI analysis and human interpretation.
💡 Pro Tip
When using AI for tasks like sentiment analysis or behavioral user insights, always validate key findings with a small manual review—this helps catch false positives and ensures reliability in high-stakes decisions.
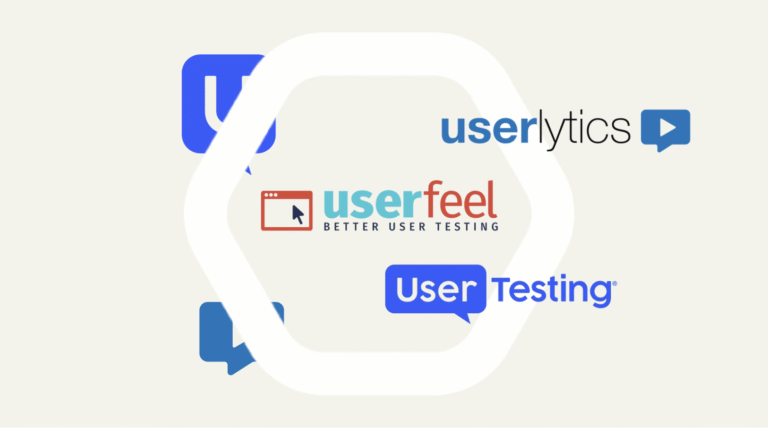
Helpful tools for UX research analysis
Using the right tools can make or break your UX research analysis. A robust research platform can help you not only collect data and insights but also analyze them effectively.
UXtweak is a great option for analyzing UX research results.
It is the only UX research platform you will ever need as it is designed in a way to support not only data collection but also analysis and synthesis.
What makes UXtweak stand out from the rest is its automated analysis tools that reduce the need for manual synthesis and analysis.
Tips for more efficient UX analysis
Here are some tips for more efficient UX analysis:
💡 Begin with clear objectives
Before starting with any research, make sure to clearly outline your research goals.
These will provide you with a necessary clarity and will ensure that your data collection and analysis are aligned with the needs of your organization.
💡 Combine both qualitative and quantitative data
Blending both qualitative and quantitative data will provide you with a more holistic picture of the user experience.
Quantitative data can pinpoint what users do, while qualitative data can explain the reason behind this behavior.
💡 Workshop it!
Analysis doesn’t have to fall only under the UX research team!
Invite cross-functional teams from design, engineering, and product to join data synthesis workshops, as this will help you create a shared understanding of the desired design outcomes.
💡 Pro Tip
Give each team a specific lens—design, tech feasibility, business impact—during analysis workshops to uncover insights that might otherwise be overlooked.
Common challenges with user research analysis

Here are some of the common challenges that come with user research analysis:
⚠️ Biases in the interpretation of results
The most common challenge when it comes to user researcher analysis is bias. To reduce cognitive biases in UX, you can try involving researchers with diverse backgrounds and perspectives during the synthesis phase.
⚠️ Lack of clear metrics
Make sure you define your KPIs and how those relate to business outcomes and users’ goals. Without predefined success metrics, it will be difficult to pinpoint what needs to be measured.
⚠️ Making stakeholders act on research results
Unfortunately, it’s common that research often stays in the drawer and goes unused. Ensure that you communicate your findings to the appropriate stakeholders.
💡 Pro Tip
Convincing stakeholders of the importance of your UX research can be challenging. Learn about getting stakeholder buy-in for UX research in this article.
How to share user research analysis findings
Sharing user research analysis findings is an important part of the user research analysis process. Here are a few formats that you can use based on your needs:
📍 UX research reports
UX research reports are a great way to present in-depth findings and design recommendations, as well as outline the analysis methodology that you have used.
📍 UX research presentations
On the other hand, presentations can also be used to share key insights and suggested actions in a visually engaging way.
📍 Video presentations
Video presentations are a winning alternative if you want to gain the buy-in of cross-functional teams.
📍 UX research workshops
Finally, organizing a UX research workshop can be a great way to collaboratively explore and translate findings into design improvements.
Wrapping up
User research analysis is a critical part of user-centred design.
It can help product teams not only to validate design decisions, but also to uncover untapped opportunities and create products that meet the ever-changing user needs.
Platforms like UXtweak can help you streamline the UX research process by automating tedious tasks and enabling enhanced synthesis through AI.
Ready to make research easier for your team? Try UXtweak for free and see how effortless user research can be! 🐝


📌 Example: Usability testing showed that users struggled with the checkout due to a confusing address form. Combined with Google Analytics data showing high drop-off at that step, the team simplified the form and clarified labels, reducing checkout abandonment by 25%.